Save entire layouts.
Chartbooks persist your mosaic tree, indicators, signal scripts, theme, watchlist, and panel state — switch between setups in one click.
Open chartbooksChartnaut turns your trading terminal into a collaborative workspace — co-build event definitions and indicators with agents, run studies on your hypotheses, and surface your learnings on-chart, matched in real time as sessions unfold.
Connect and trade through
Chartnaut supports 54 CFDs across currencies, indices, and commodities, 30+ crypto assets, and modern perpetual futures like SP500 and NIKKEI.
Live market coverage is the foundation: one charting workflow across asset classes, built for active discretionary analysis.
Trading Connectivity
Connect your MT4 or MT5 broker account, or open a Chartnaut Demo account — then analyse and execute from the same workflow without leaving the terminal.
Chartnaut supports 54 CFDs across currencies, indices, and commodities, 30+ crypto assets, and modern perpetual futures like SP500 and NIKKEI.
Live market coverage is the foundation: one charting workflow across asset classes, built for active discretionary analysis.
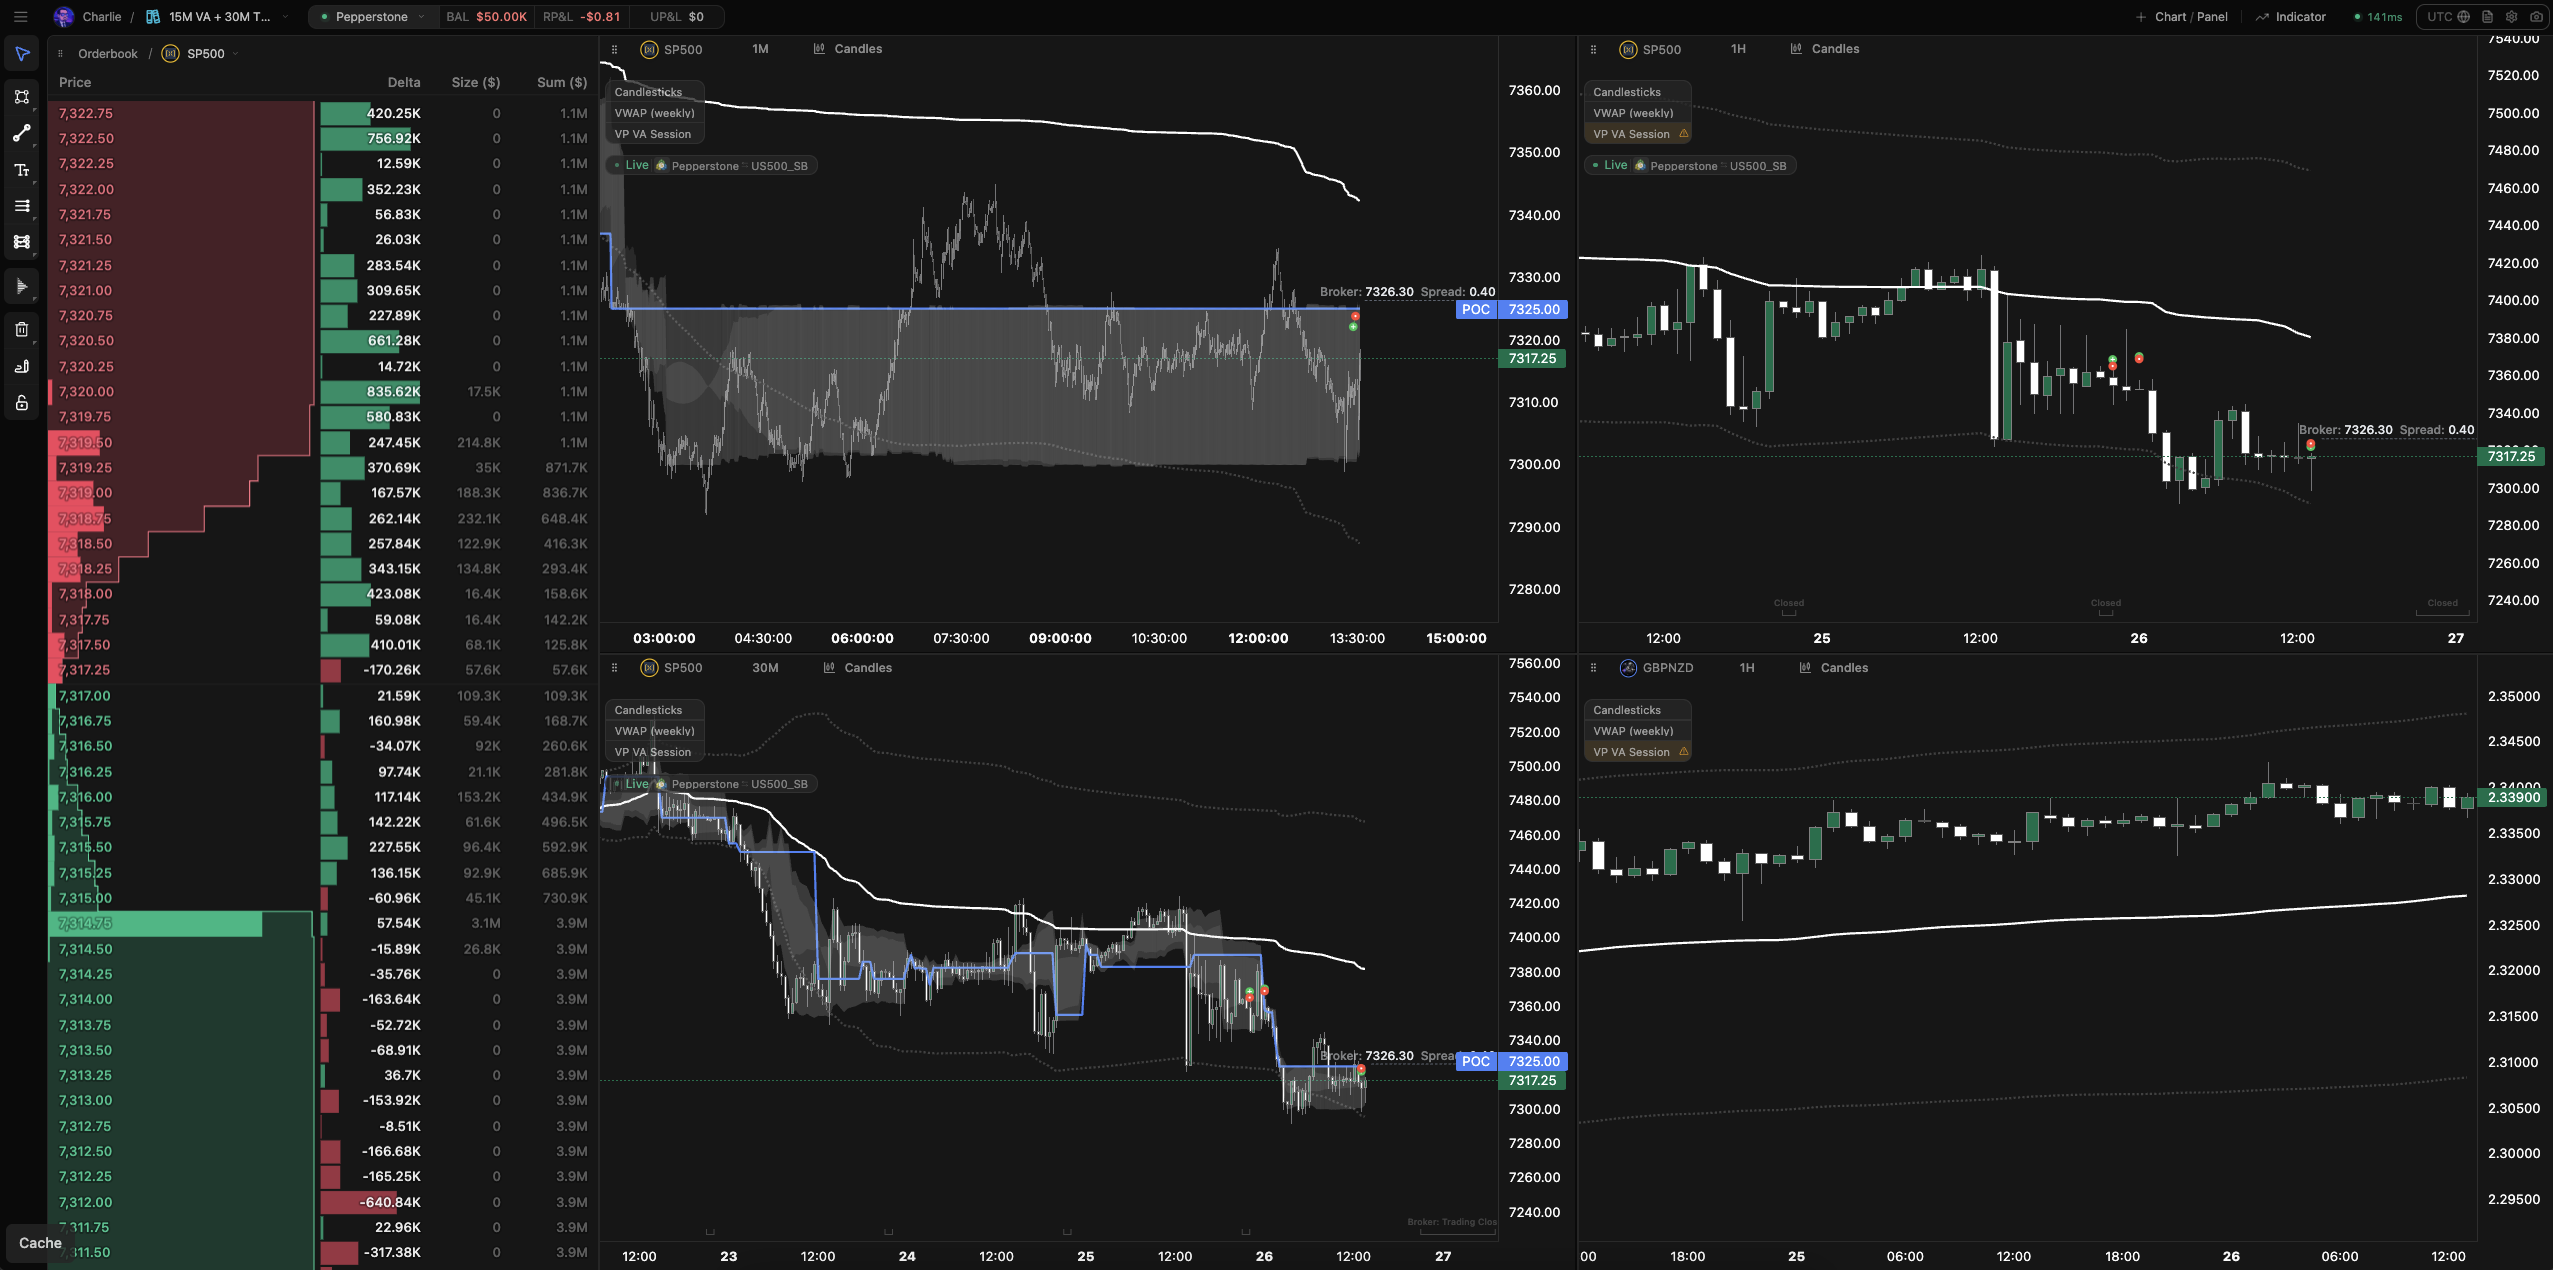
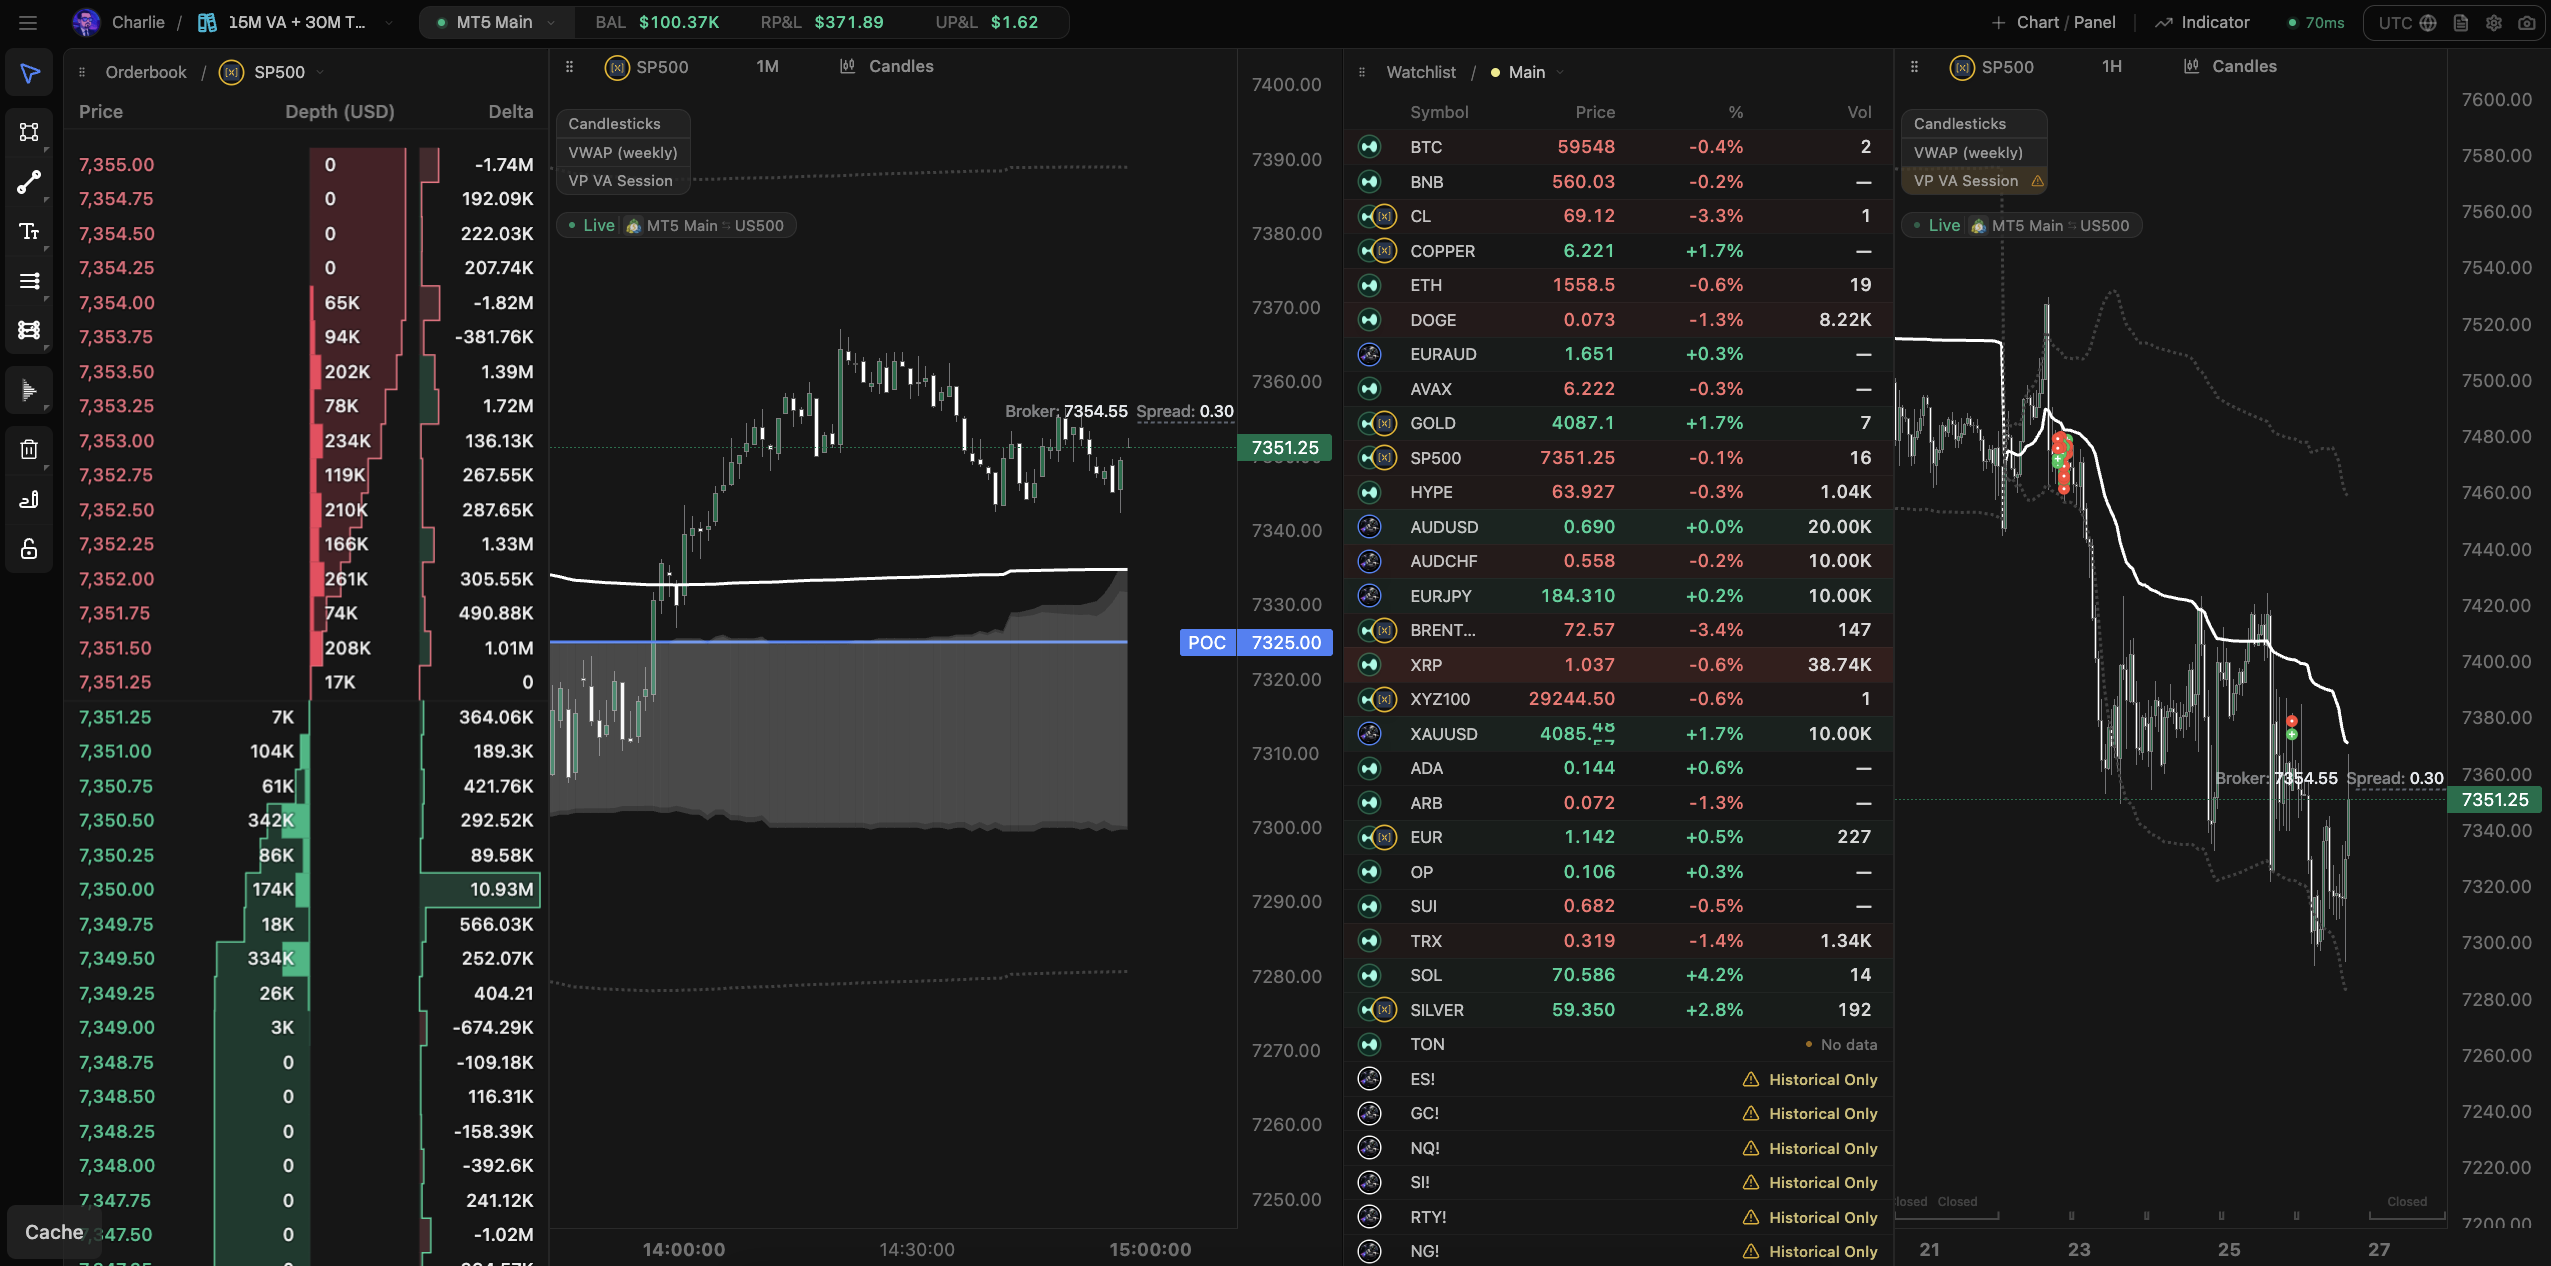
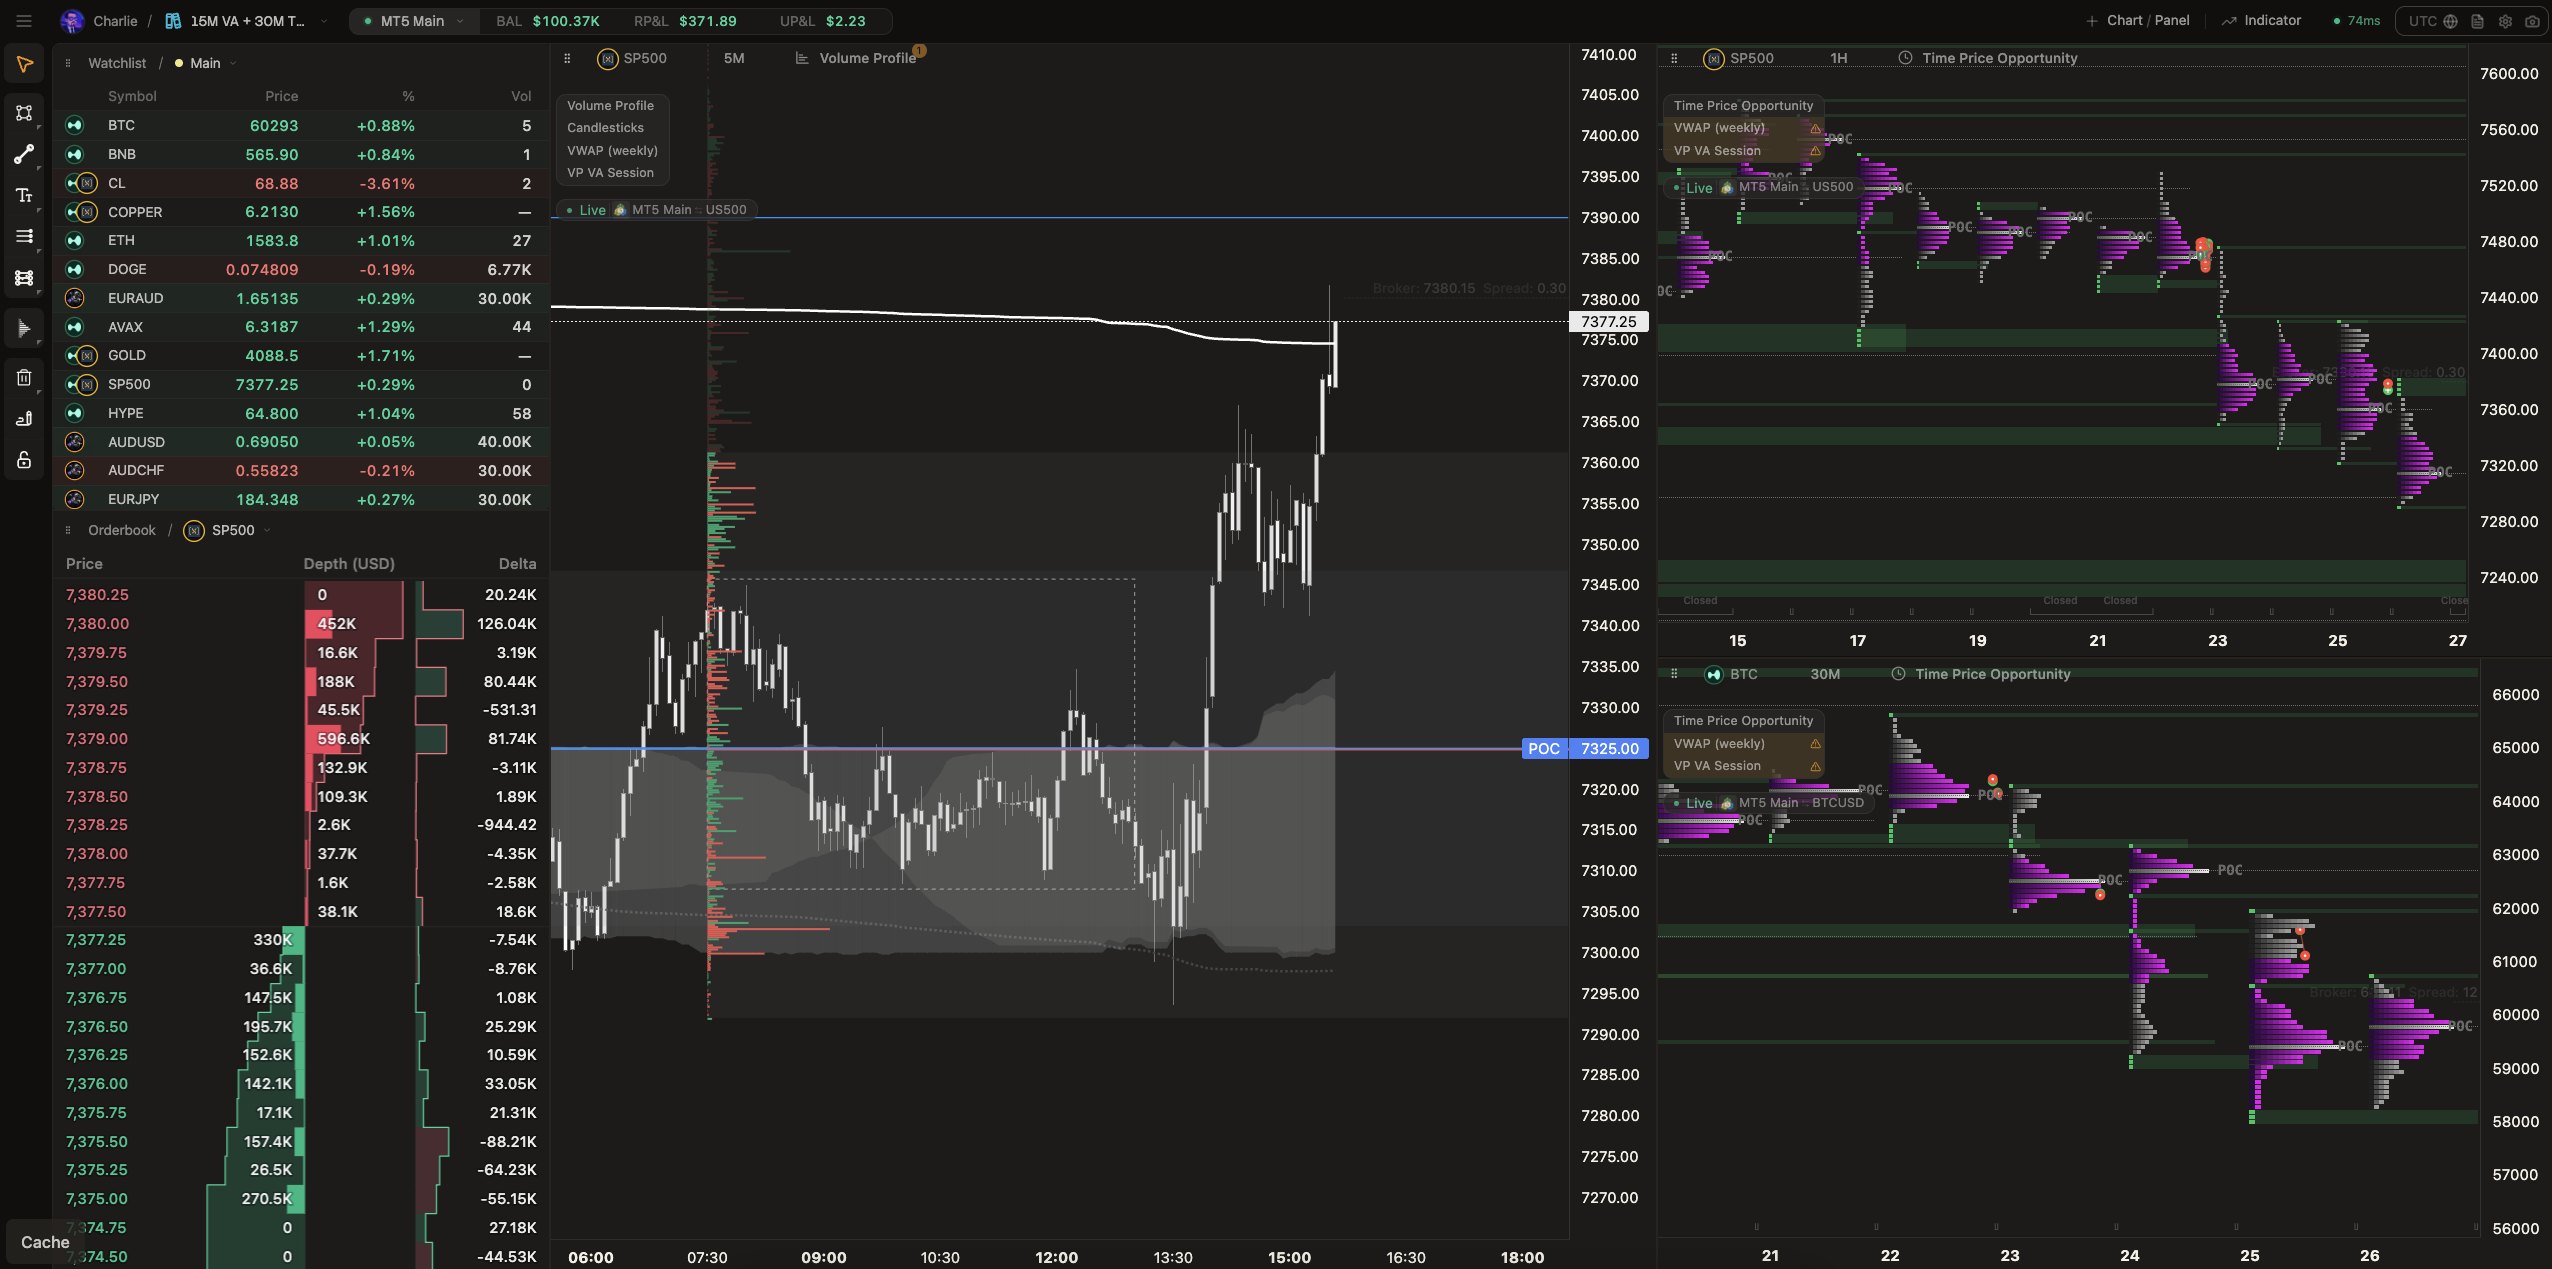
Drag-and-drop mosaic panels for charts, watchlist, depth of market, and position management. Save everything as a chartbook — layout, indicators, signal scripts, theme, and watchlist together.
Chartbooks persist your mosaic tree, indicators, signal scripts, theme, watchlist, and panel state — switch between setups in one click.
Open chartbooks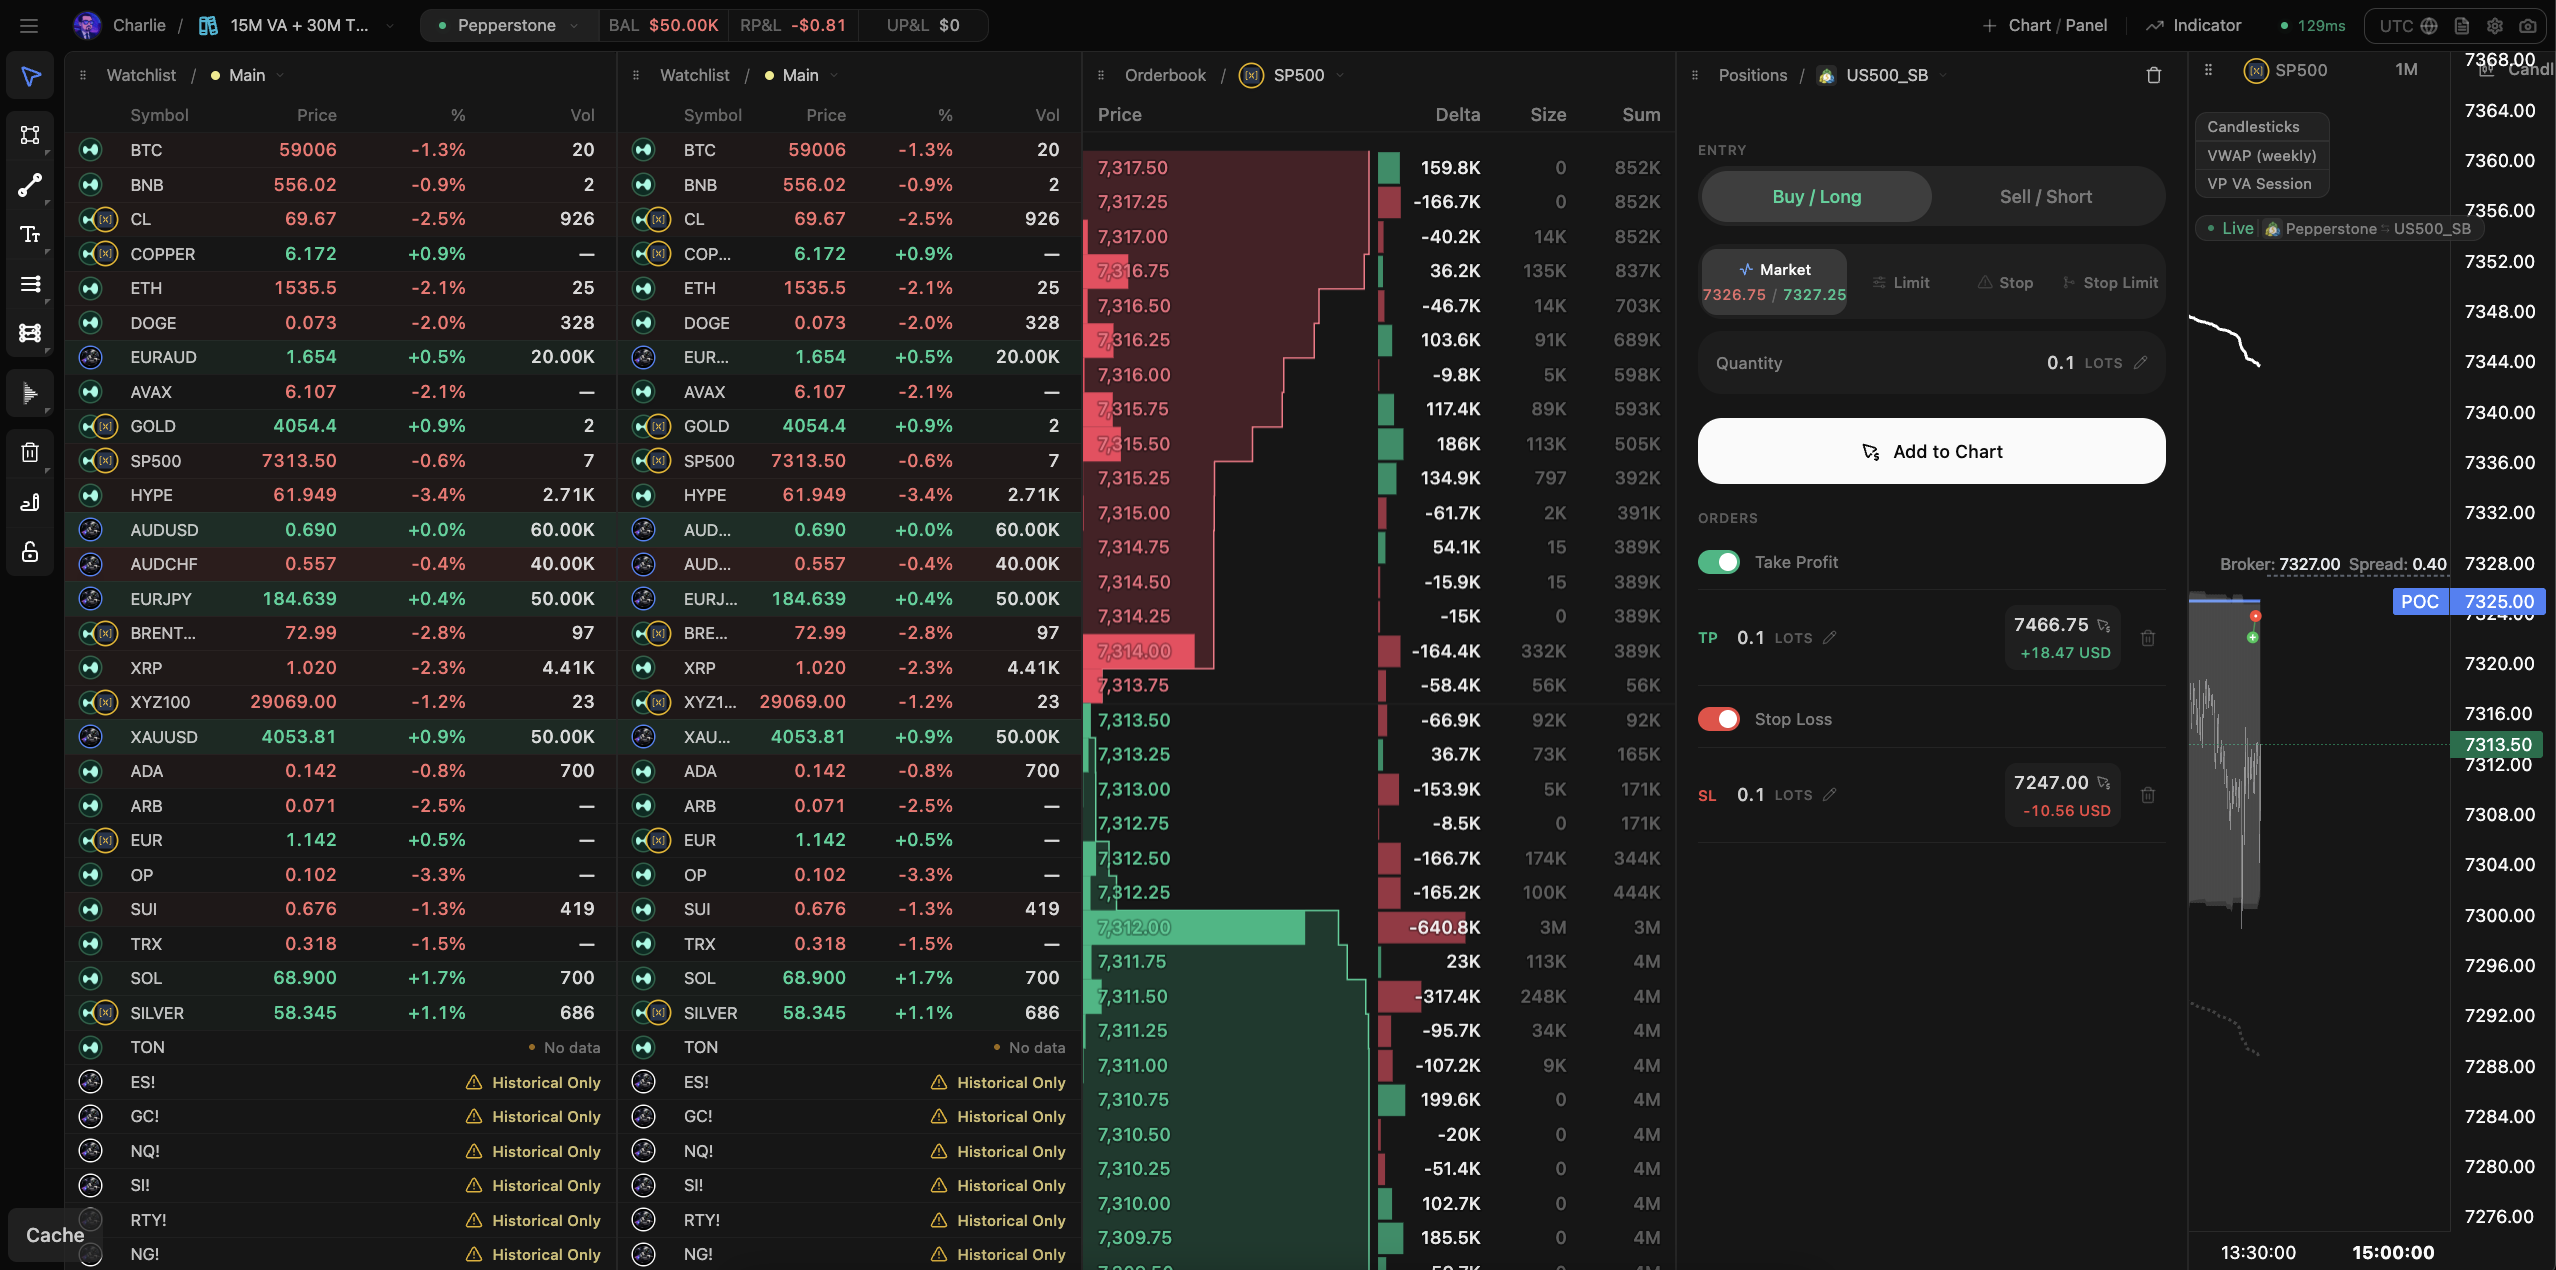
Mix charts with a watchlist, depth of market, and position manager. Up to eight panels total — charts and tools in one mosaic.
Build a layoutDefinitions, studies, indicators, and trades — built with agents, surfaced on chart.
Define events→Run studies→Pin on chart
Run a study on how the session behaves after NY open — balanced, rotational, or trend — then pin the result to the chart. When the event fires, the breakdown is already there.
“After NY open on ES, how often is the rest of the session balanced vs rotational vs trend?”
Open in terminal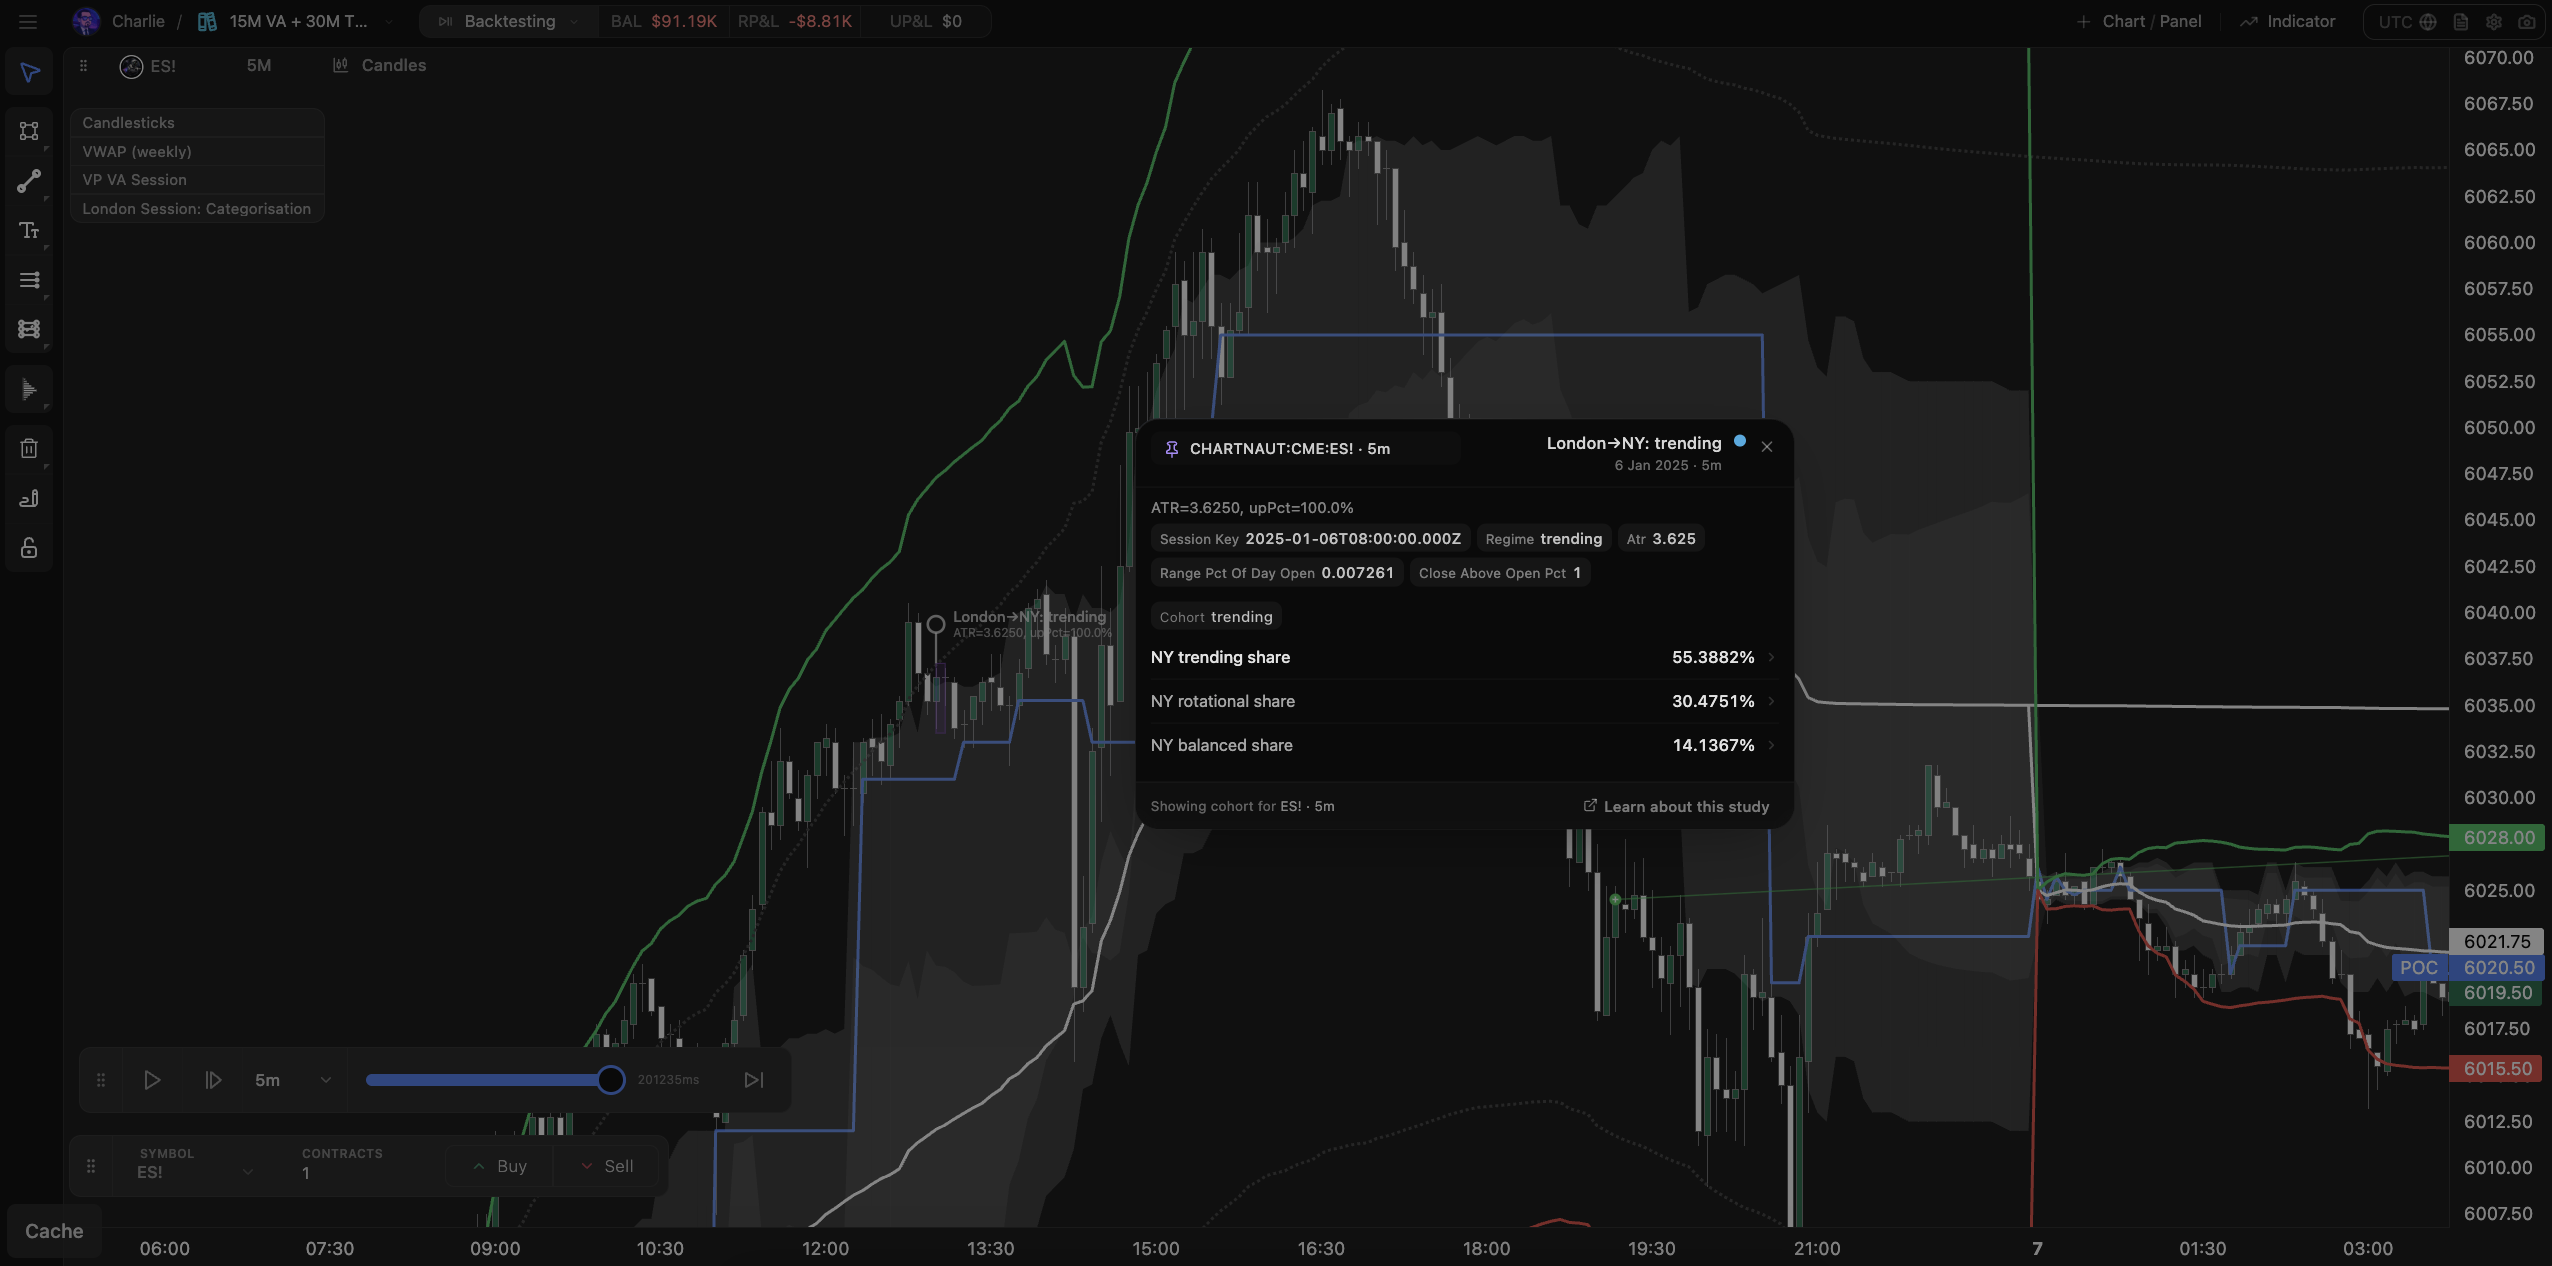
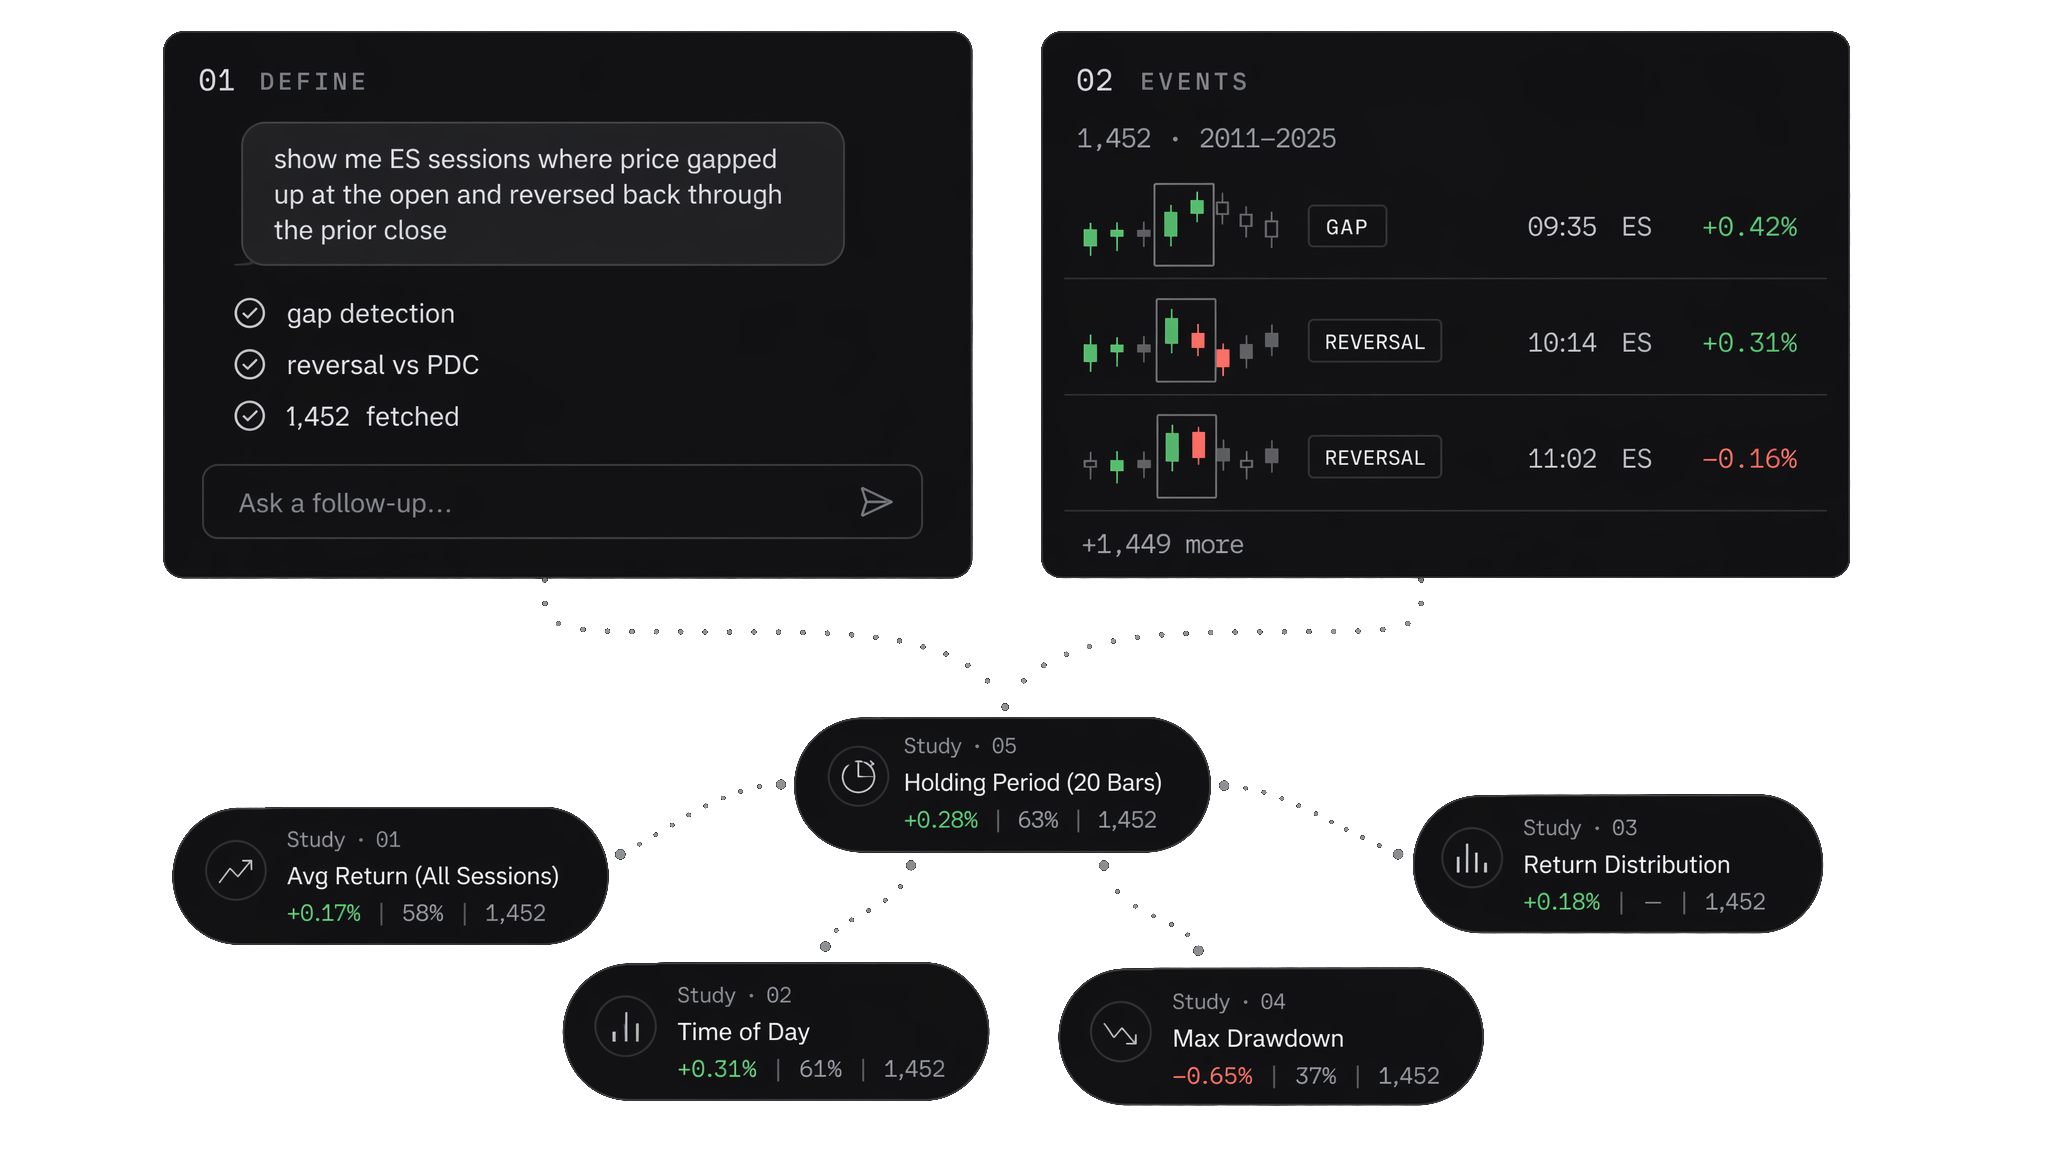
Formalise NY opening breakouts, London session structure, and liquidity sweeps — then collect every occurrence across years of data. Studies run on these definitions.
“Define NY opening range breakouts above the first 15-minute high.”
Open in terminal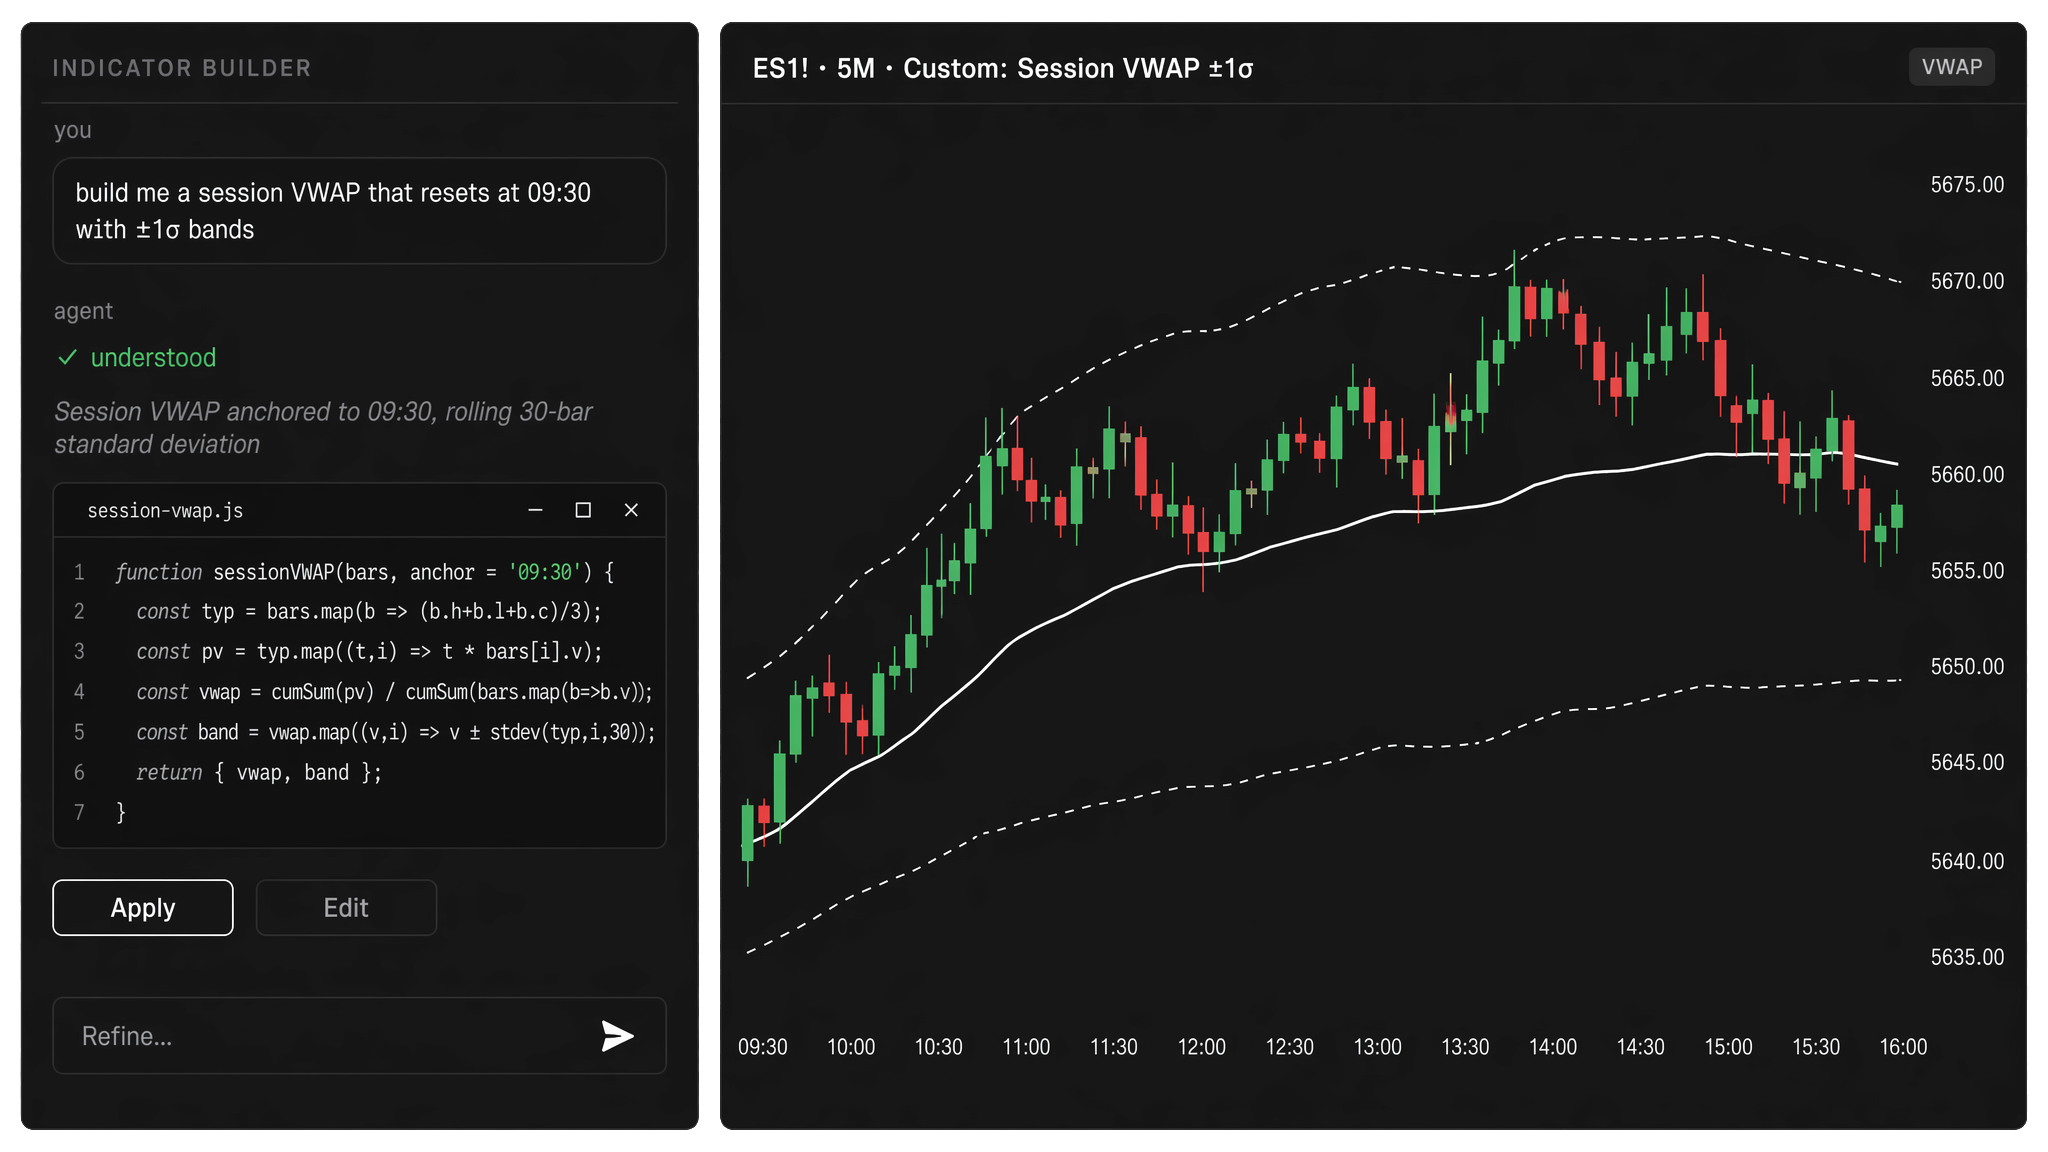
Describe what you want plotted — including volume-tape logic — and refine together. Signal scripts compile natively on the chart engine.
“Create a rolling value area high/low indicator.”
Open in terminal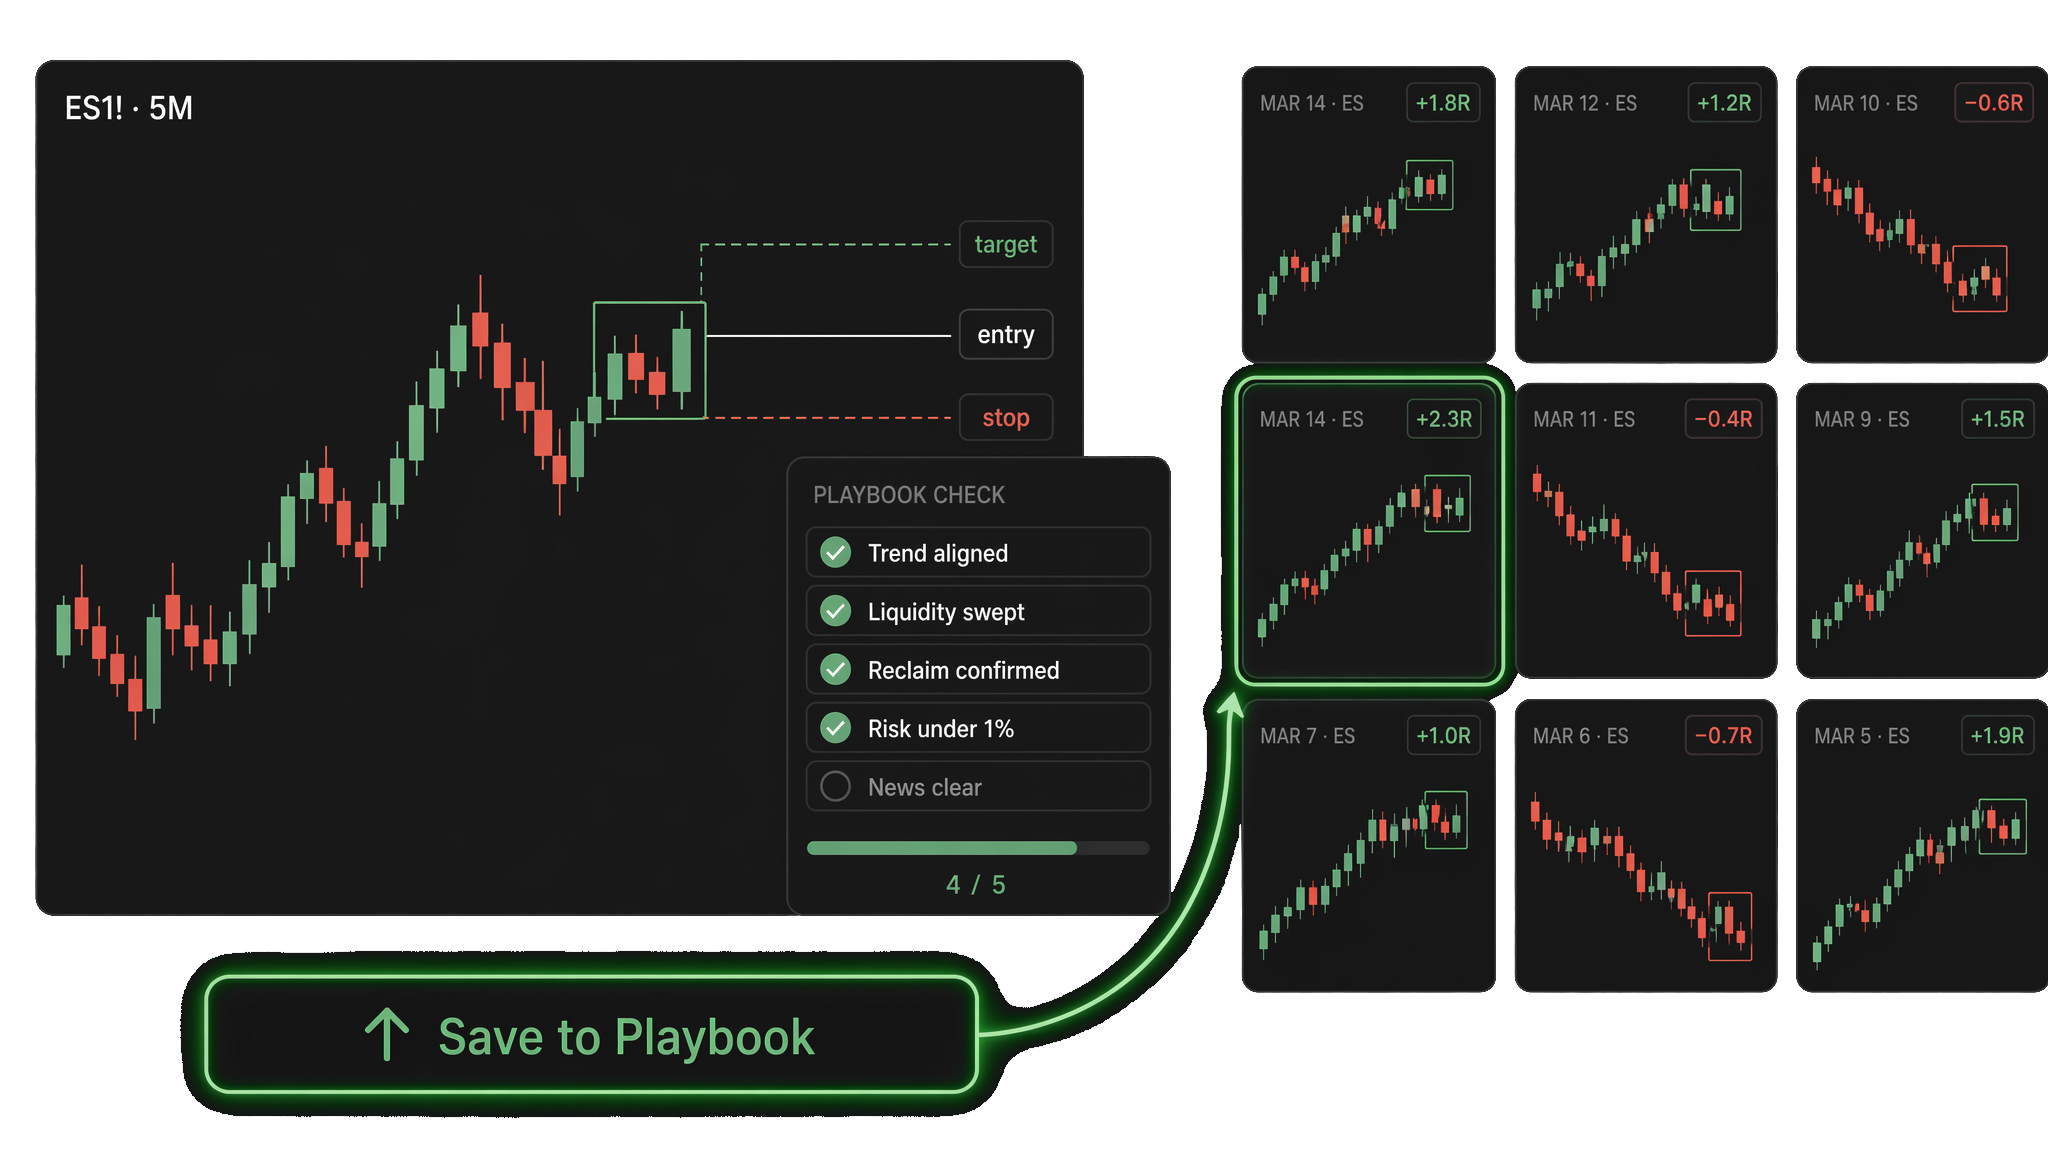
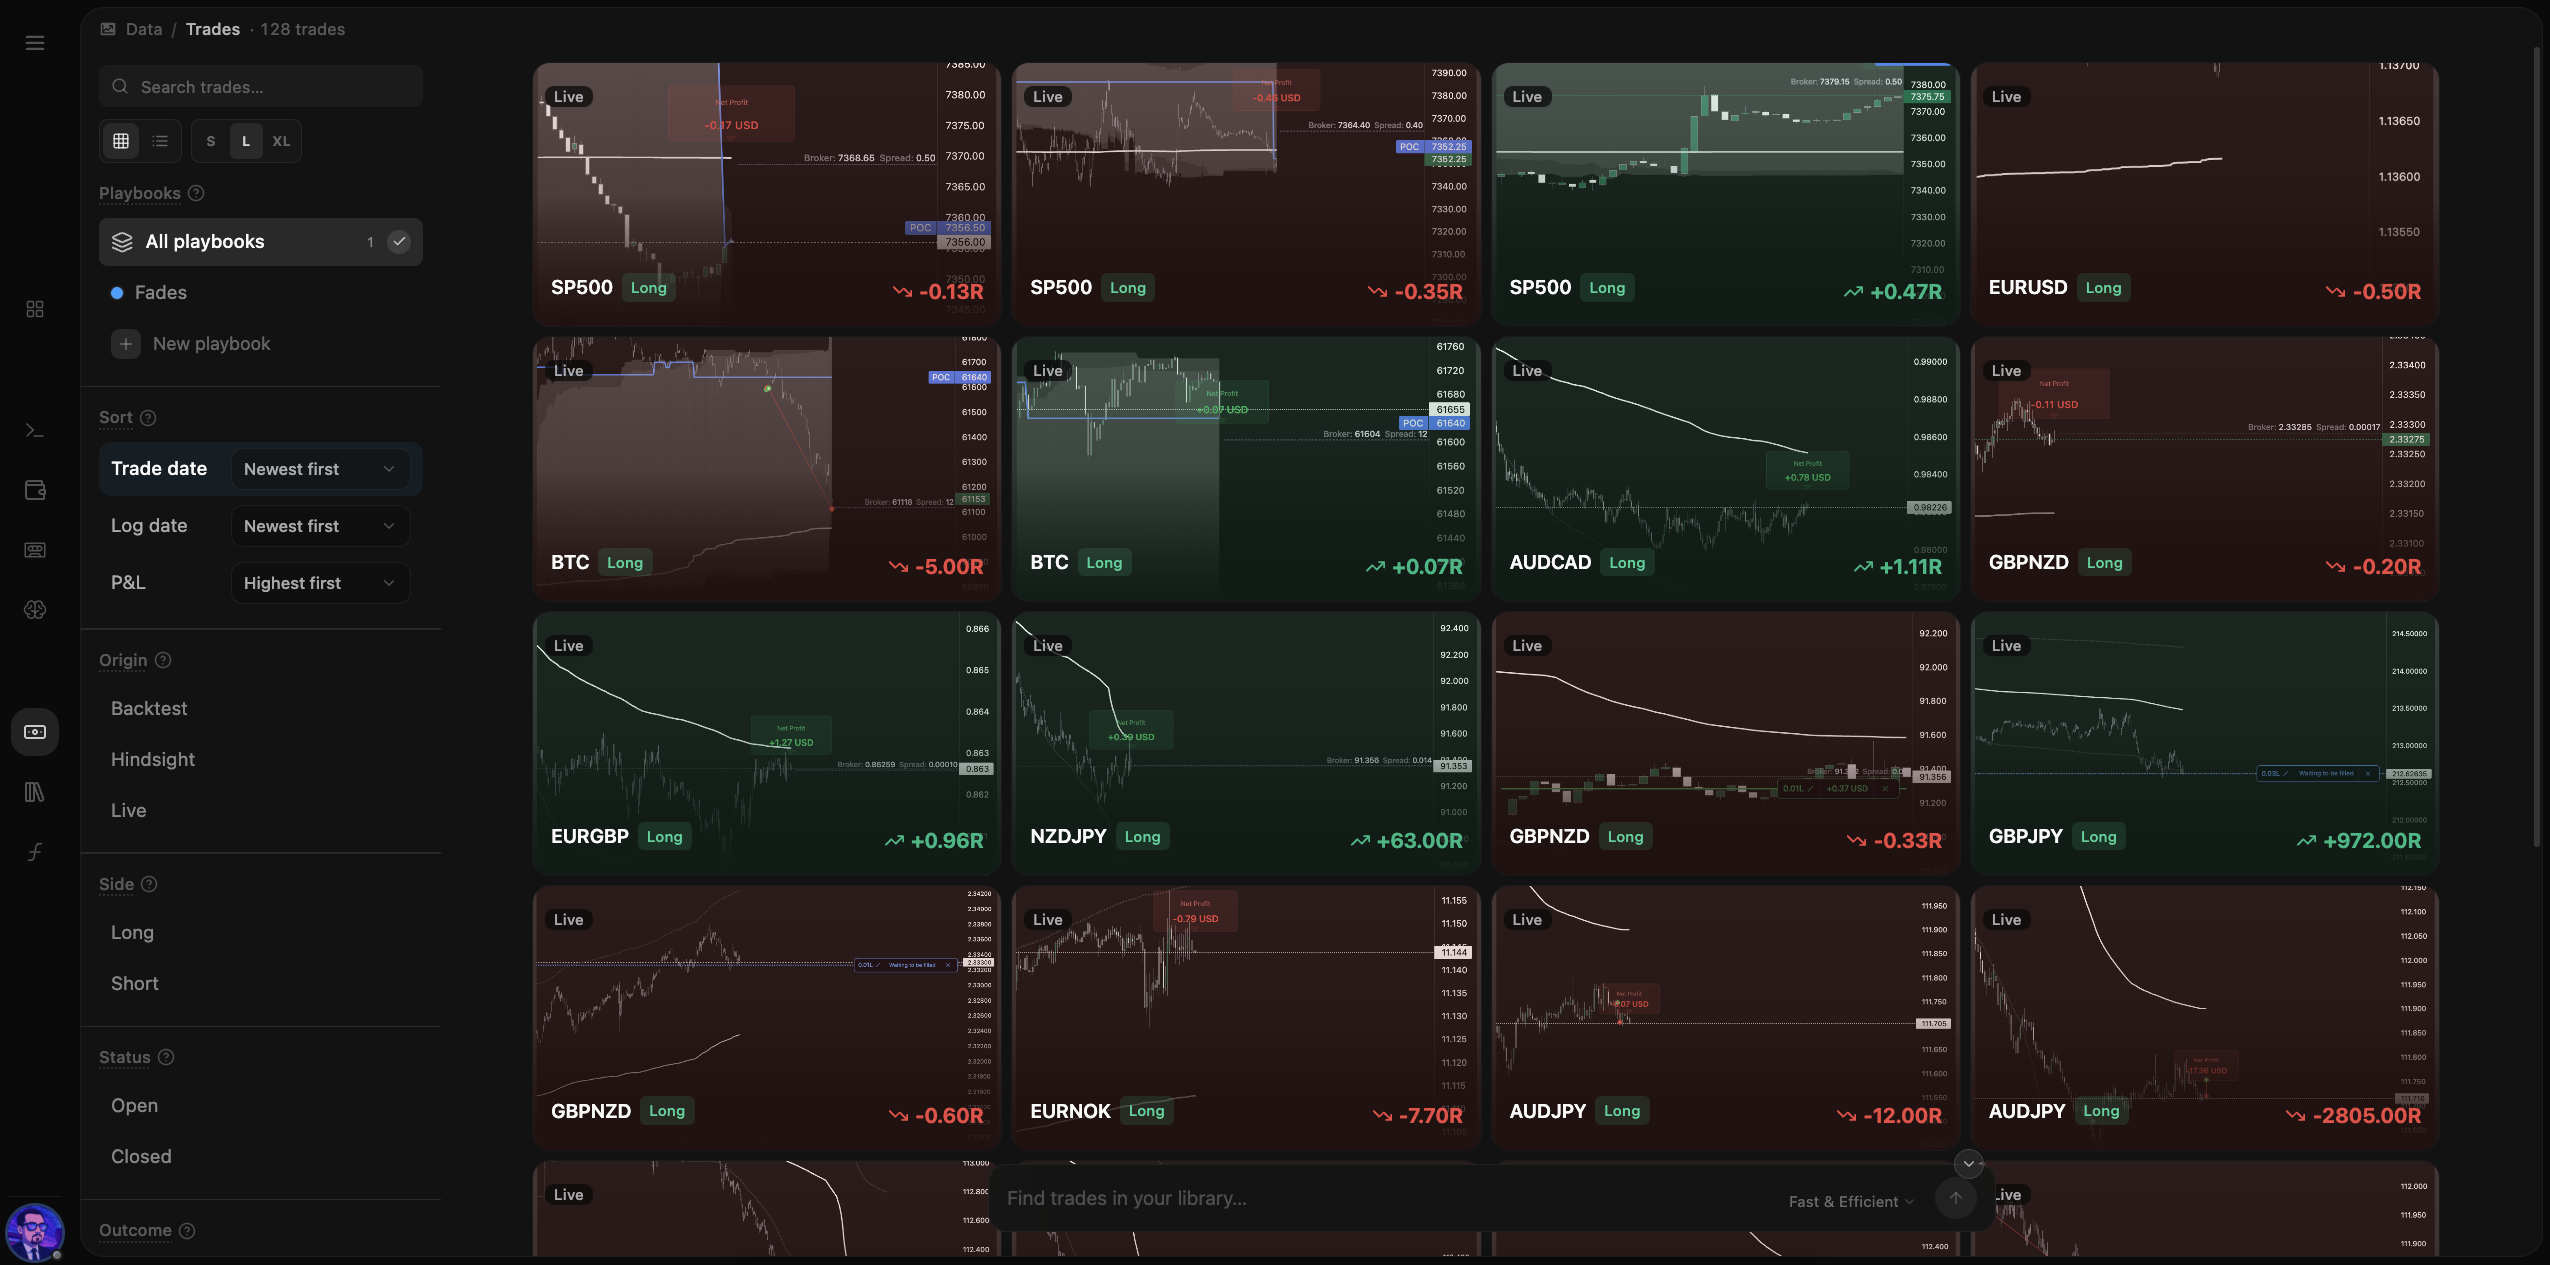
Every trade from the terminal lands in a searchable library. Ask what you mean instead of building filters by hand.
“Find me trades that opened close to VWAP.”
Open in terminalAdvanced chart types, built-in indicators, custom signal scripts, terminal themes, and session replay — without breaking your mosaic.
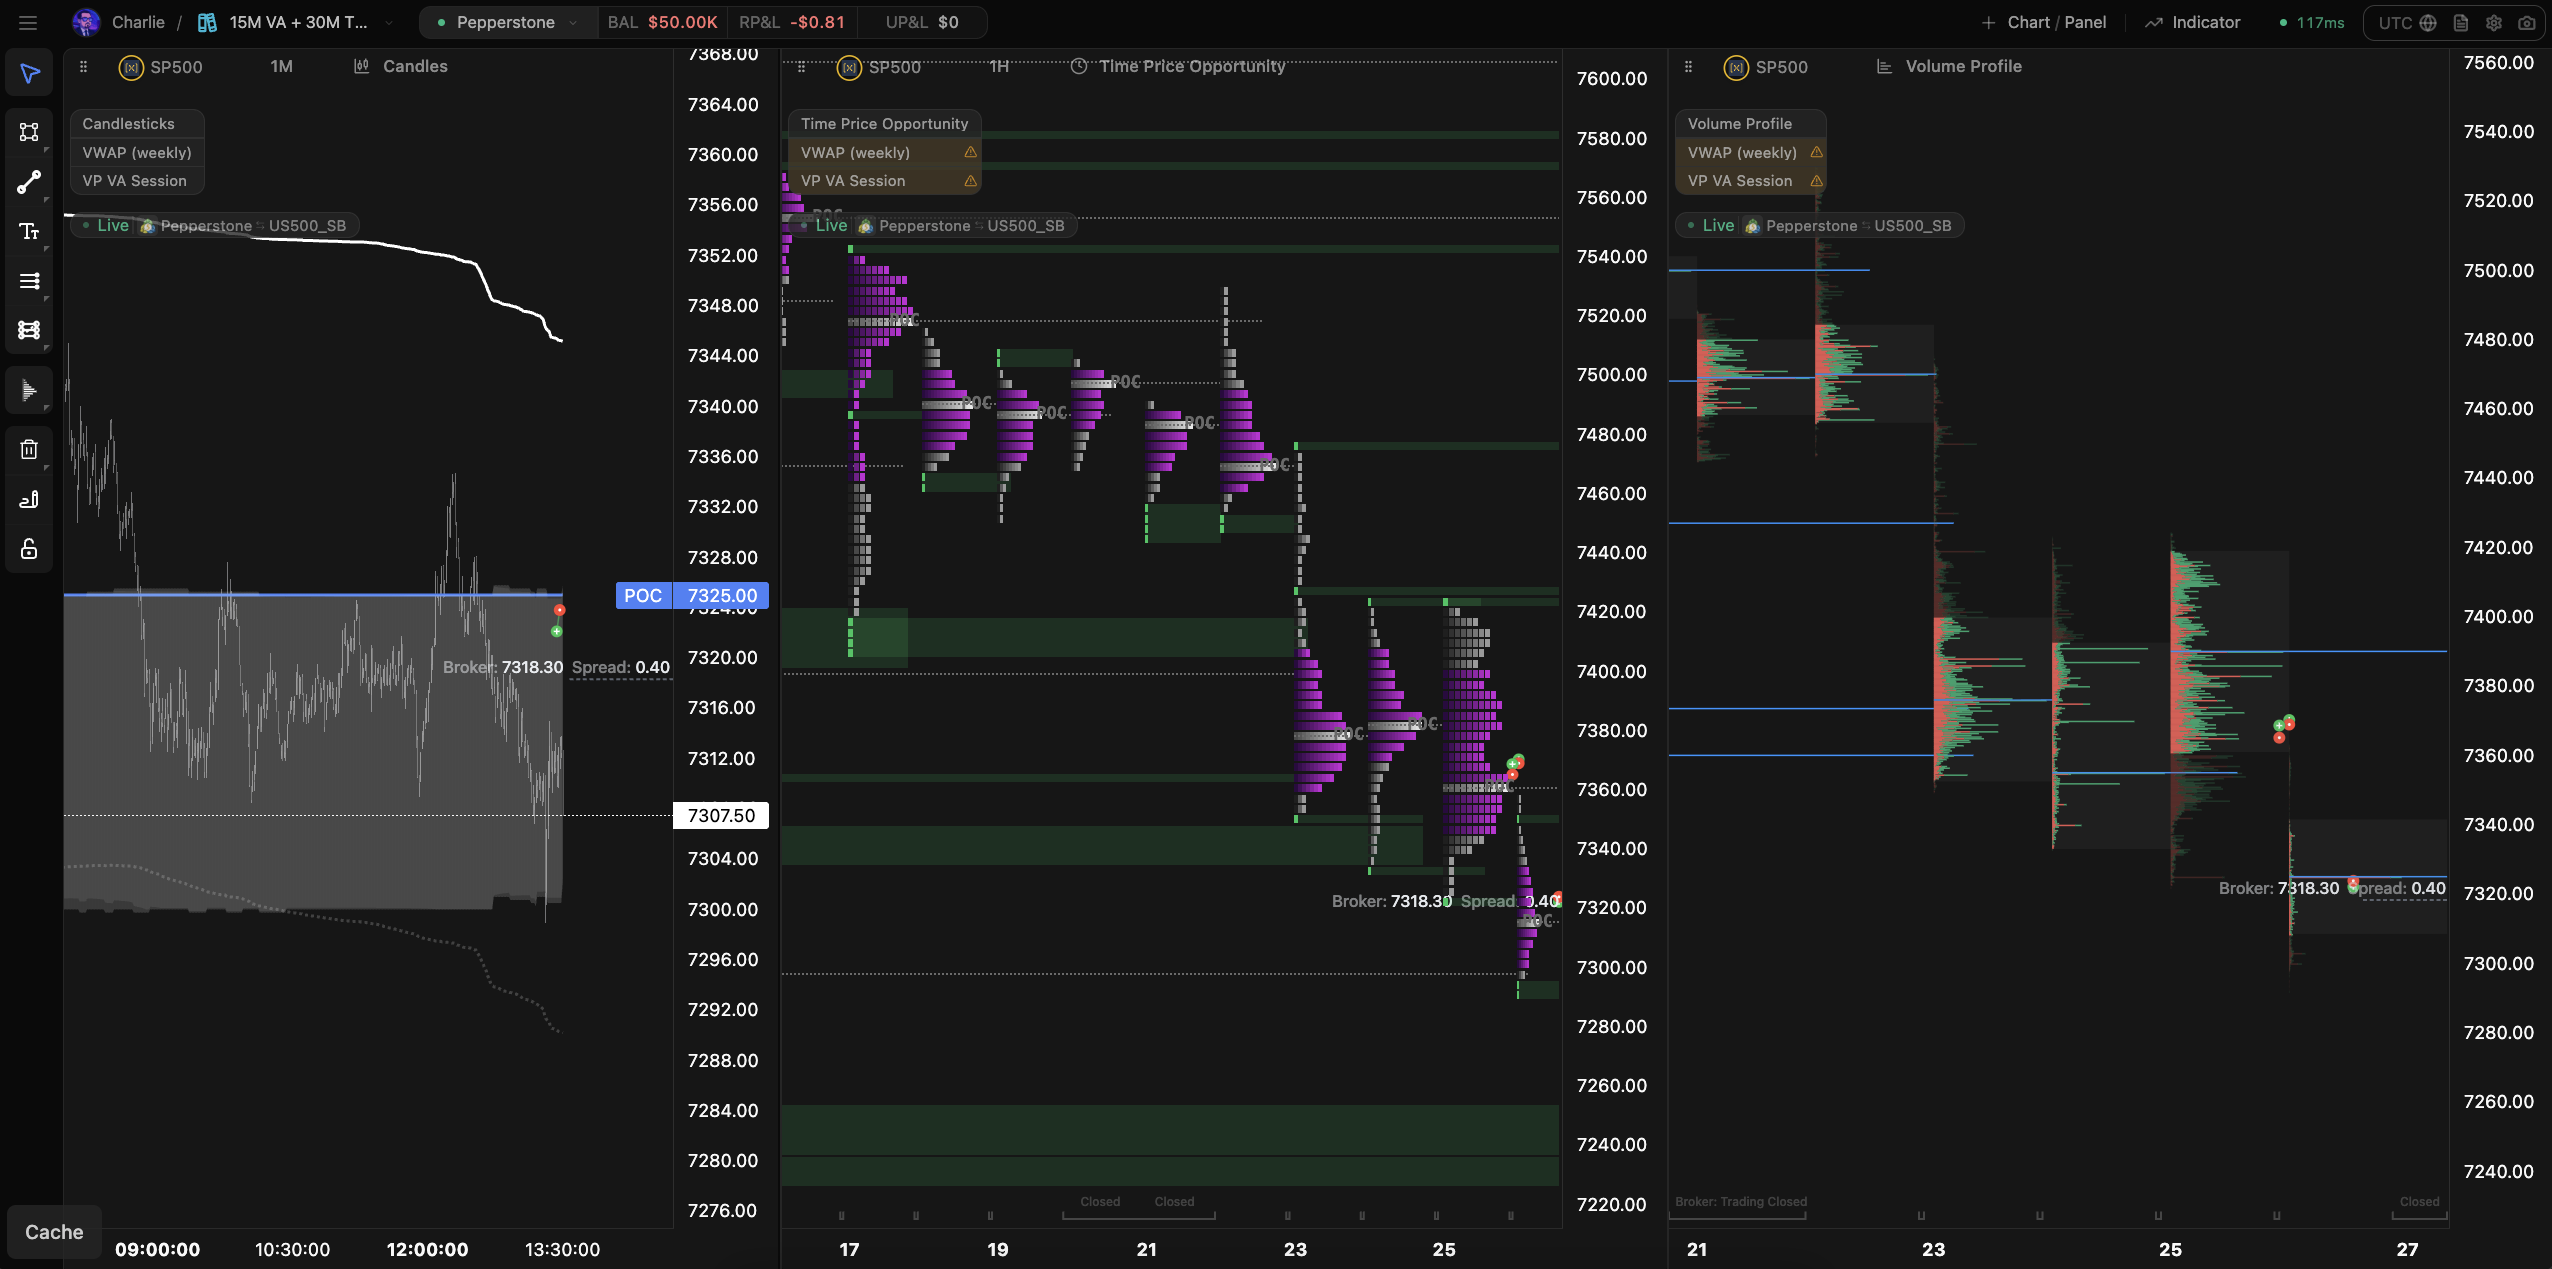
Candles, Heikin-Ashi, footprint, TPO, volume profile, volume bubbles, cumulative delta, and more — with profile overlays on standard charts.
Browse markets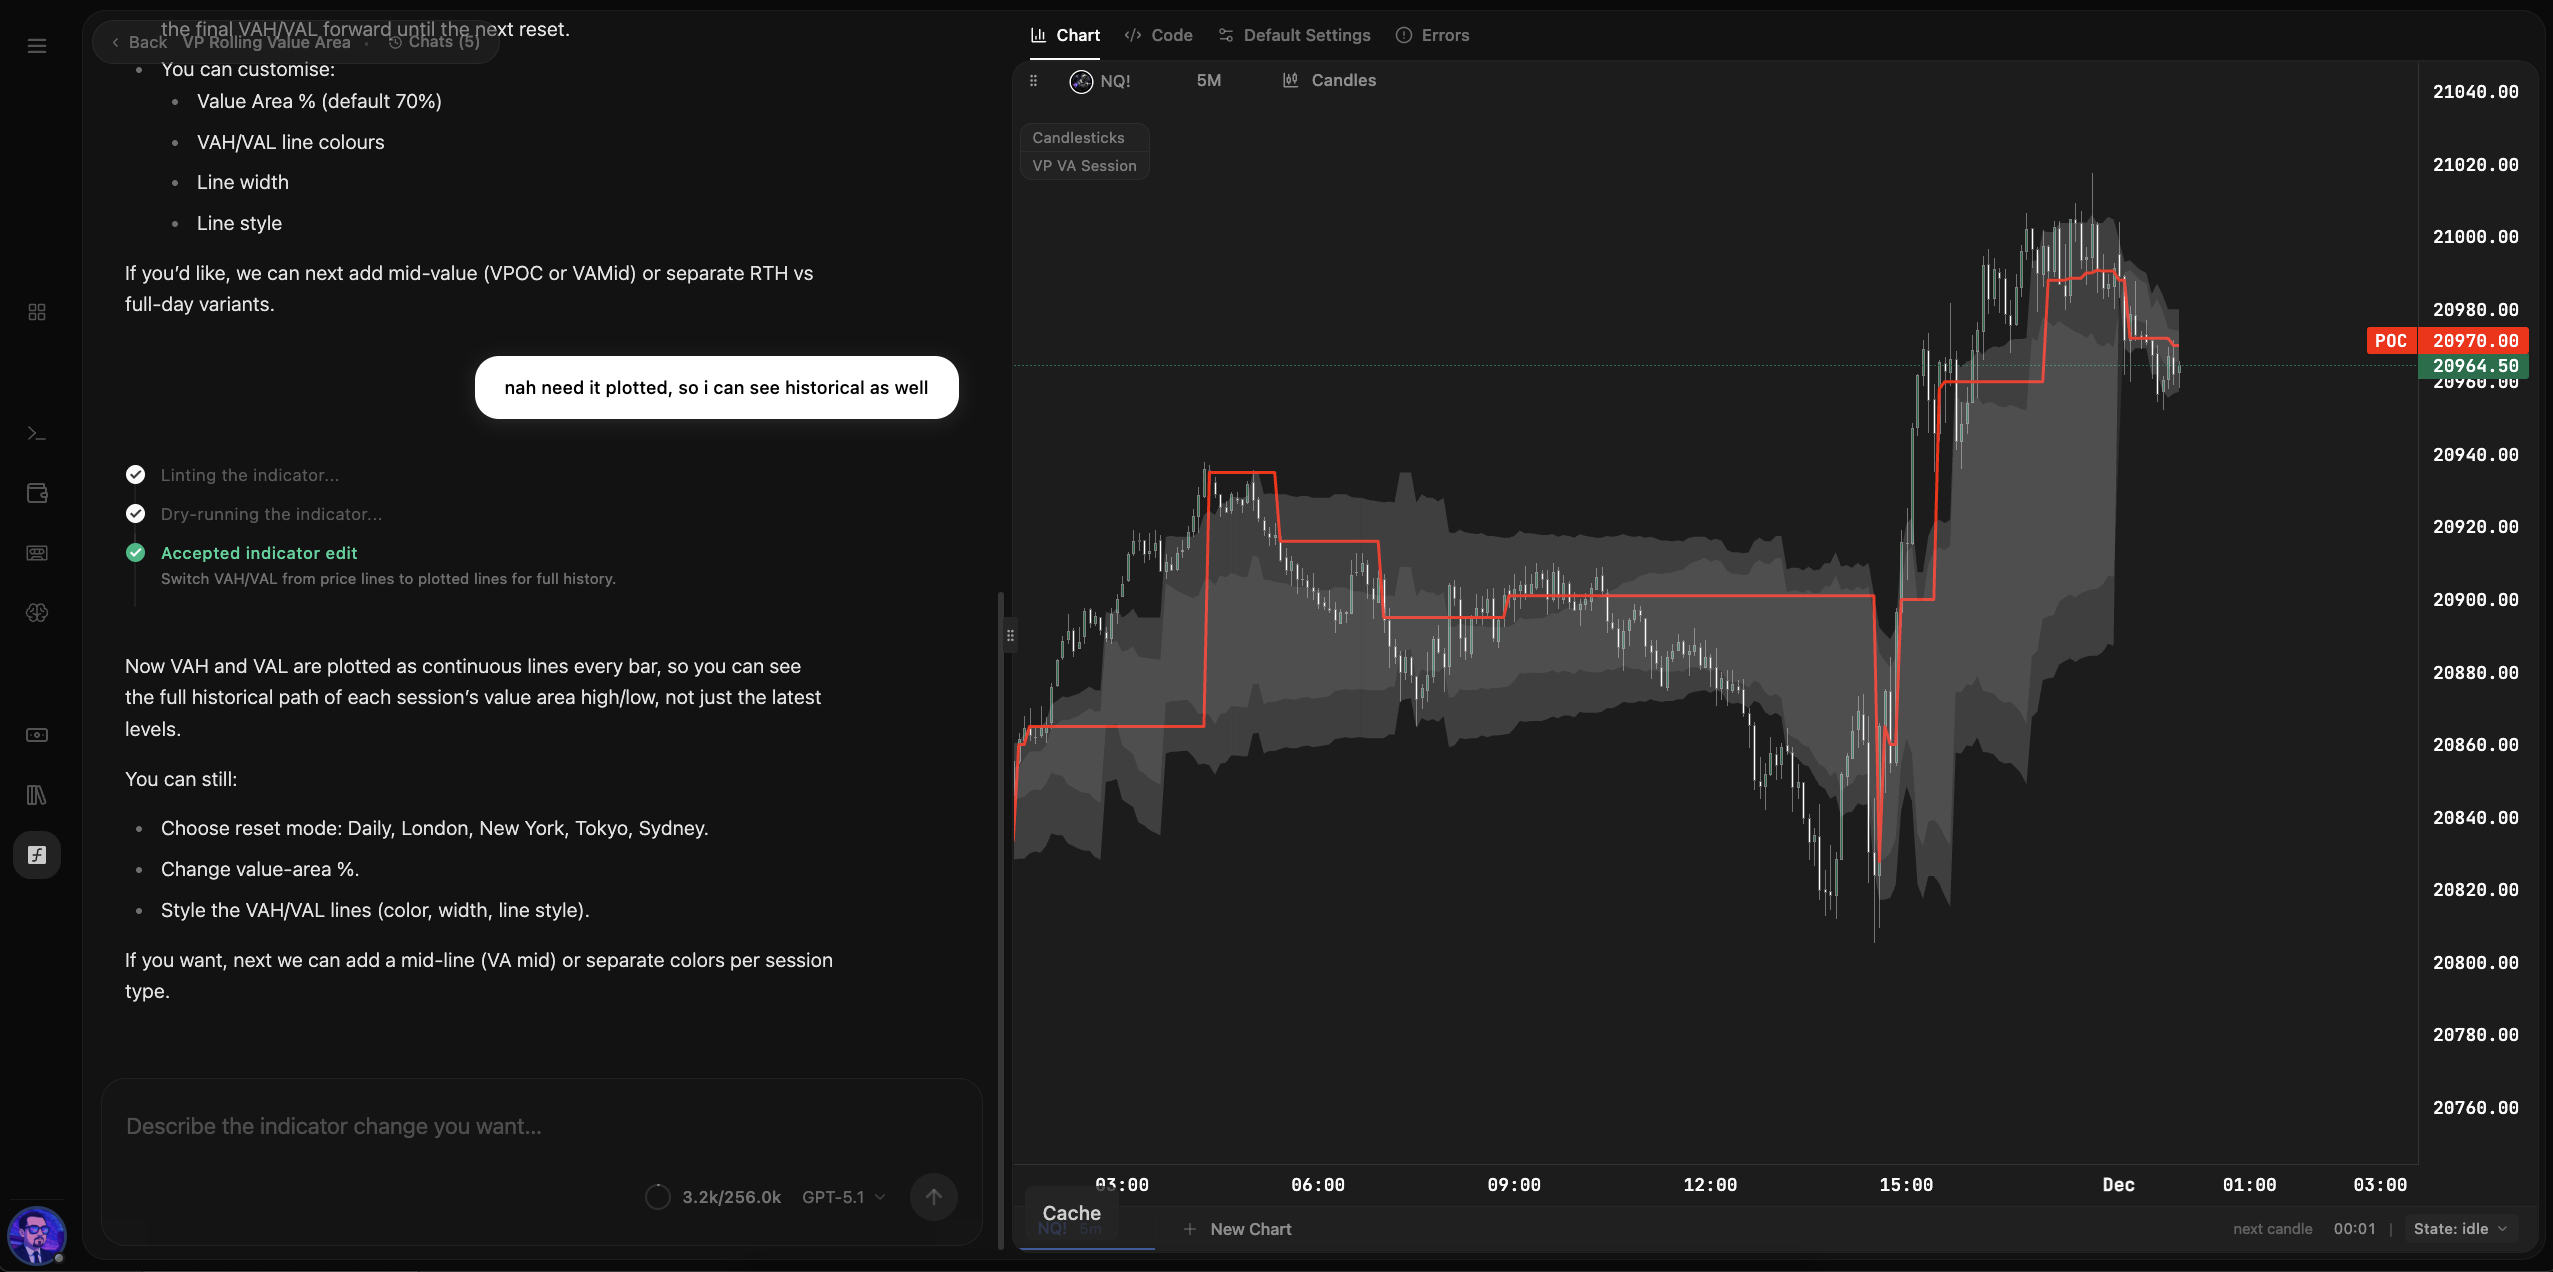
36 built-in indicators including ten moving-average types — write your own signal scripts, or install from the indicator & signal community library in a click.
Browse the library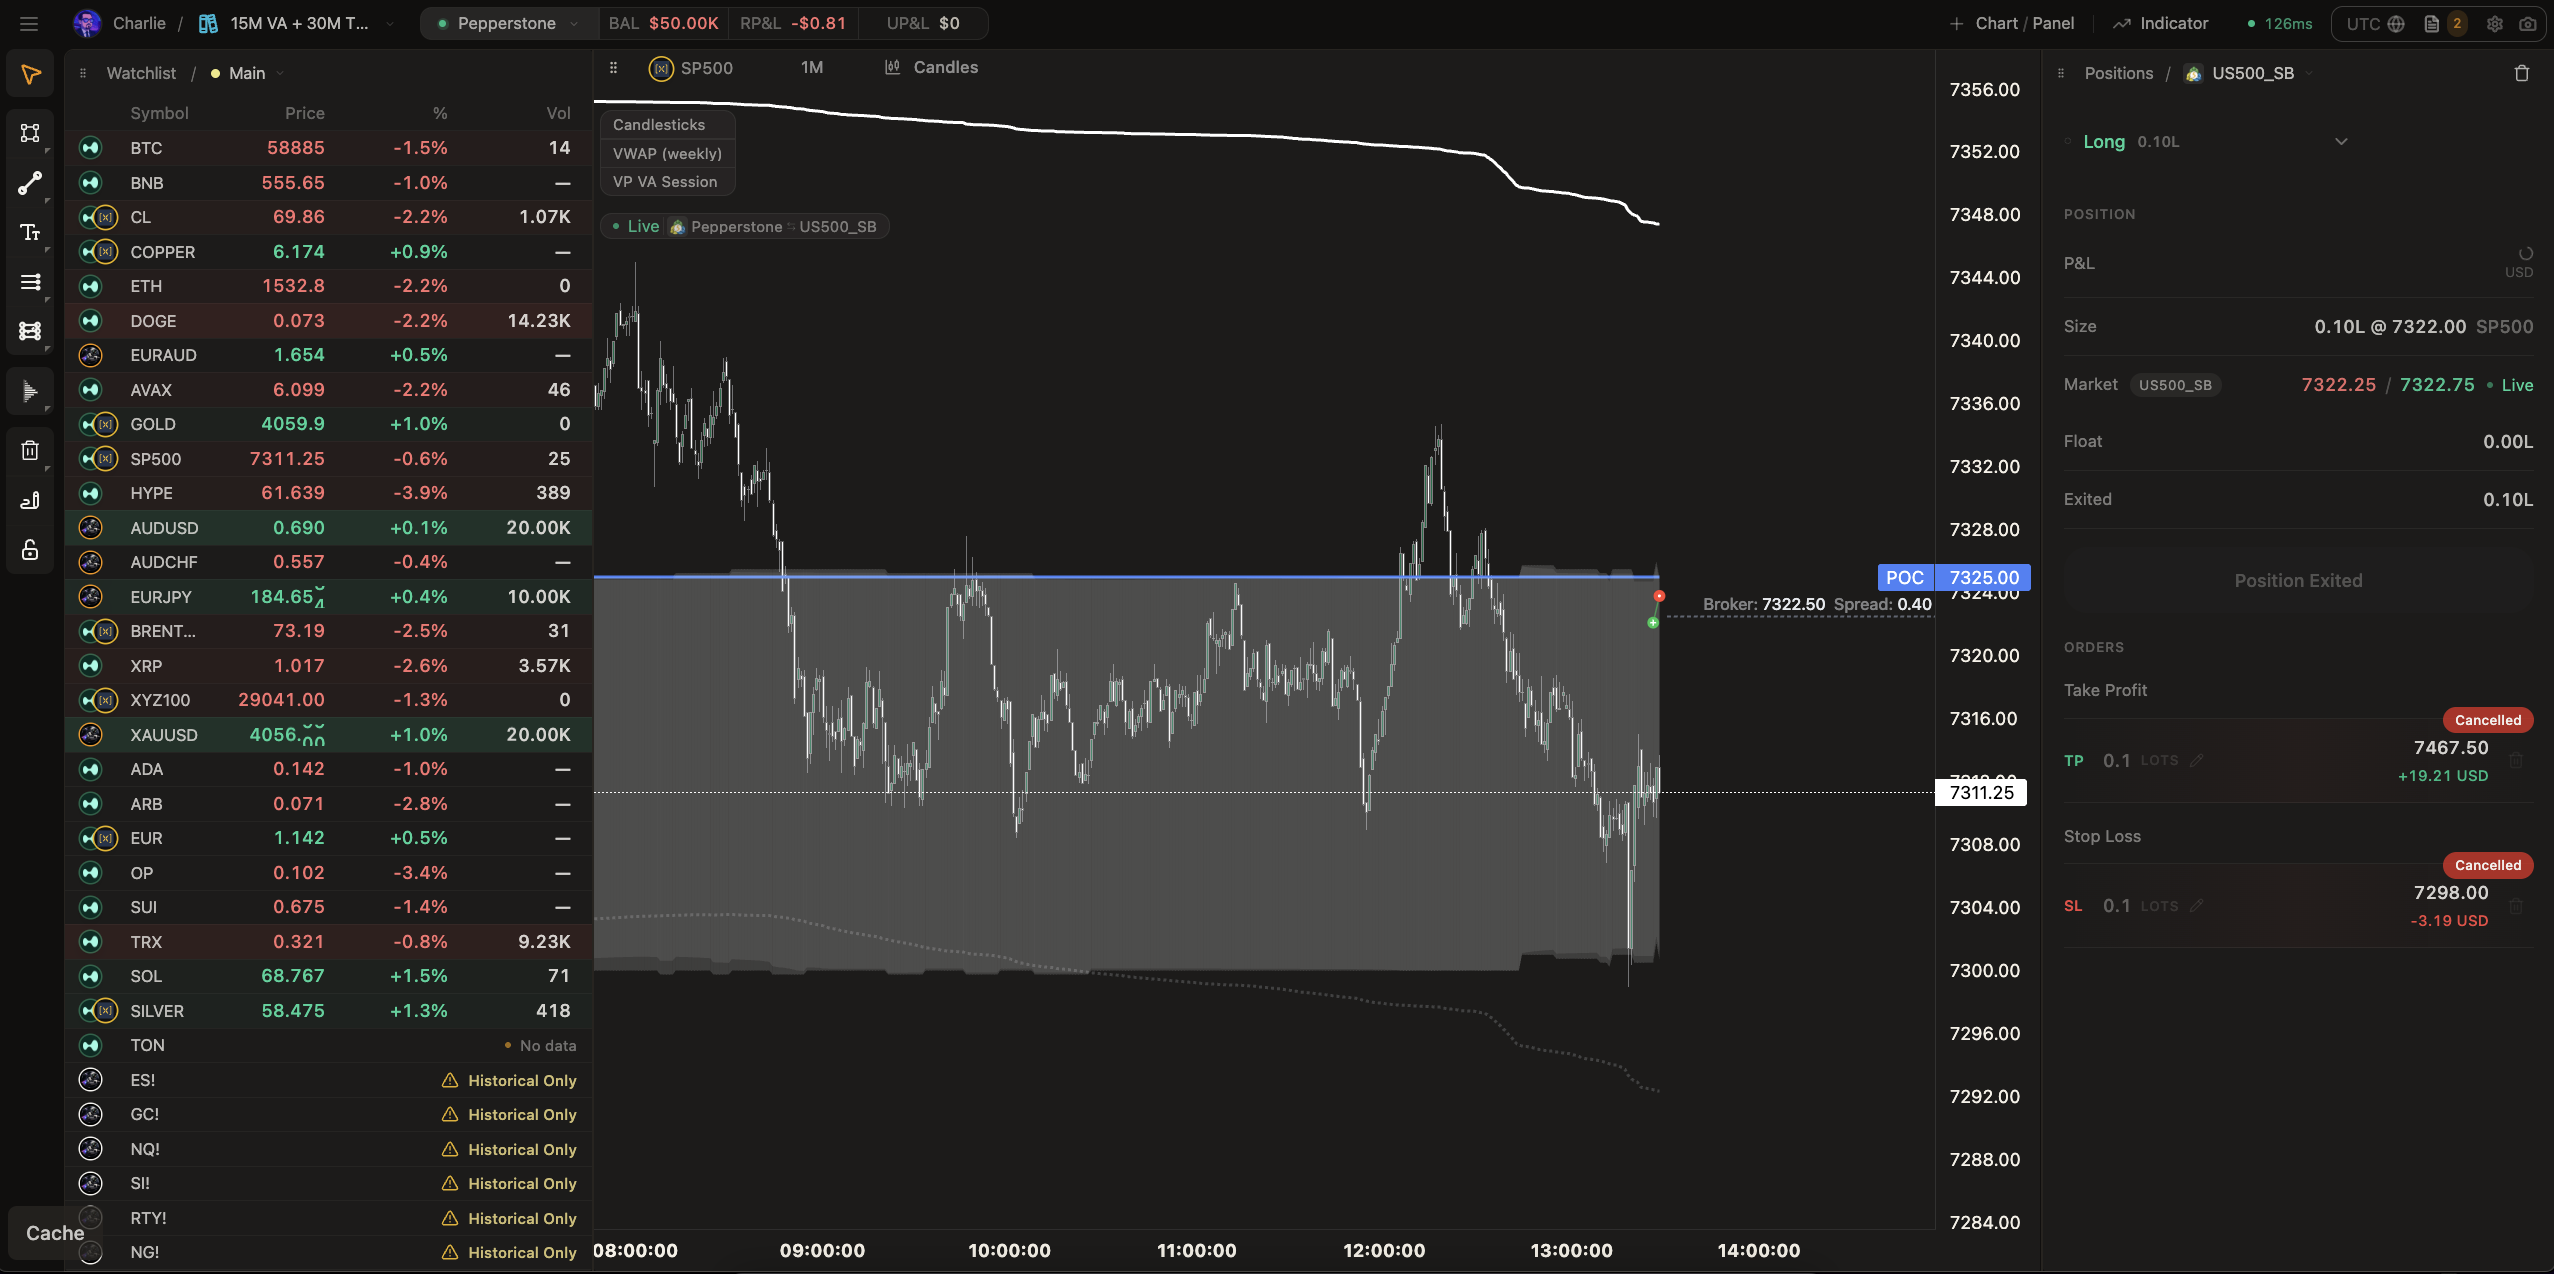
Eleven dark and four light presets — Deep Focus, Emerald, Cyberpunk, Polaris, and more. Customize chart background and label styling.
Customize appearance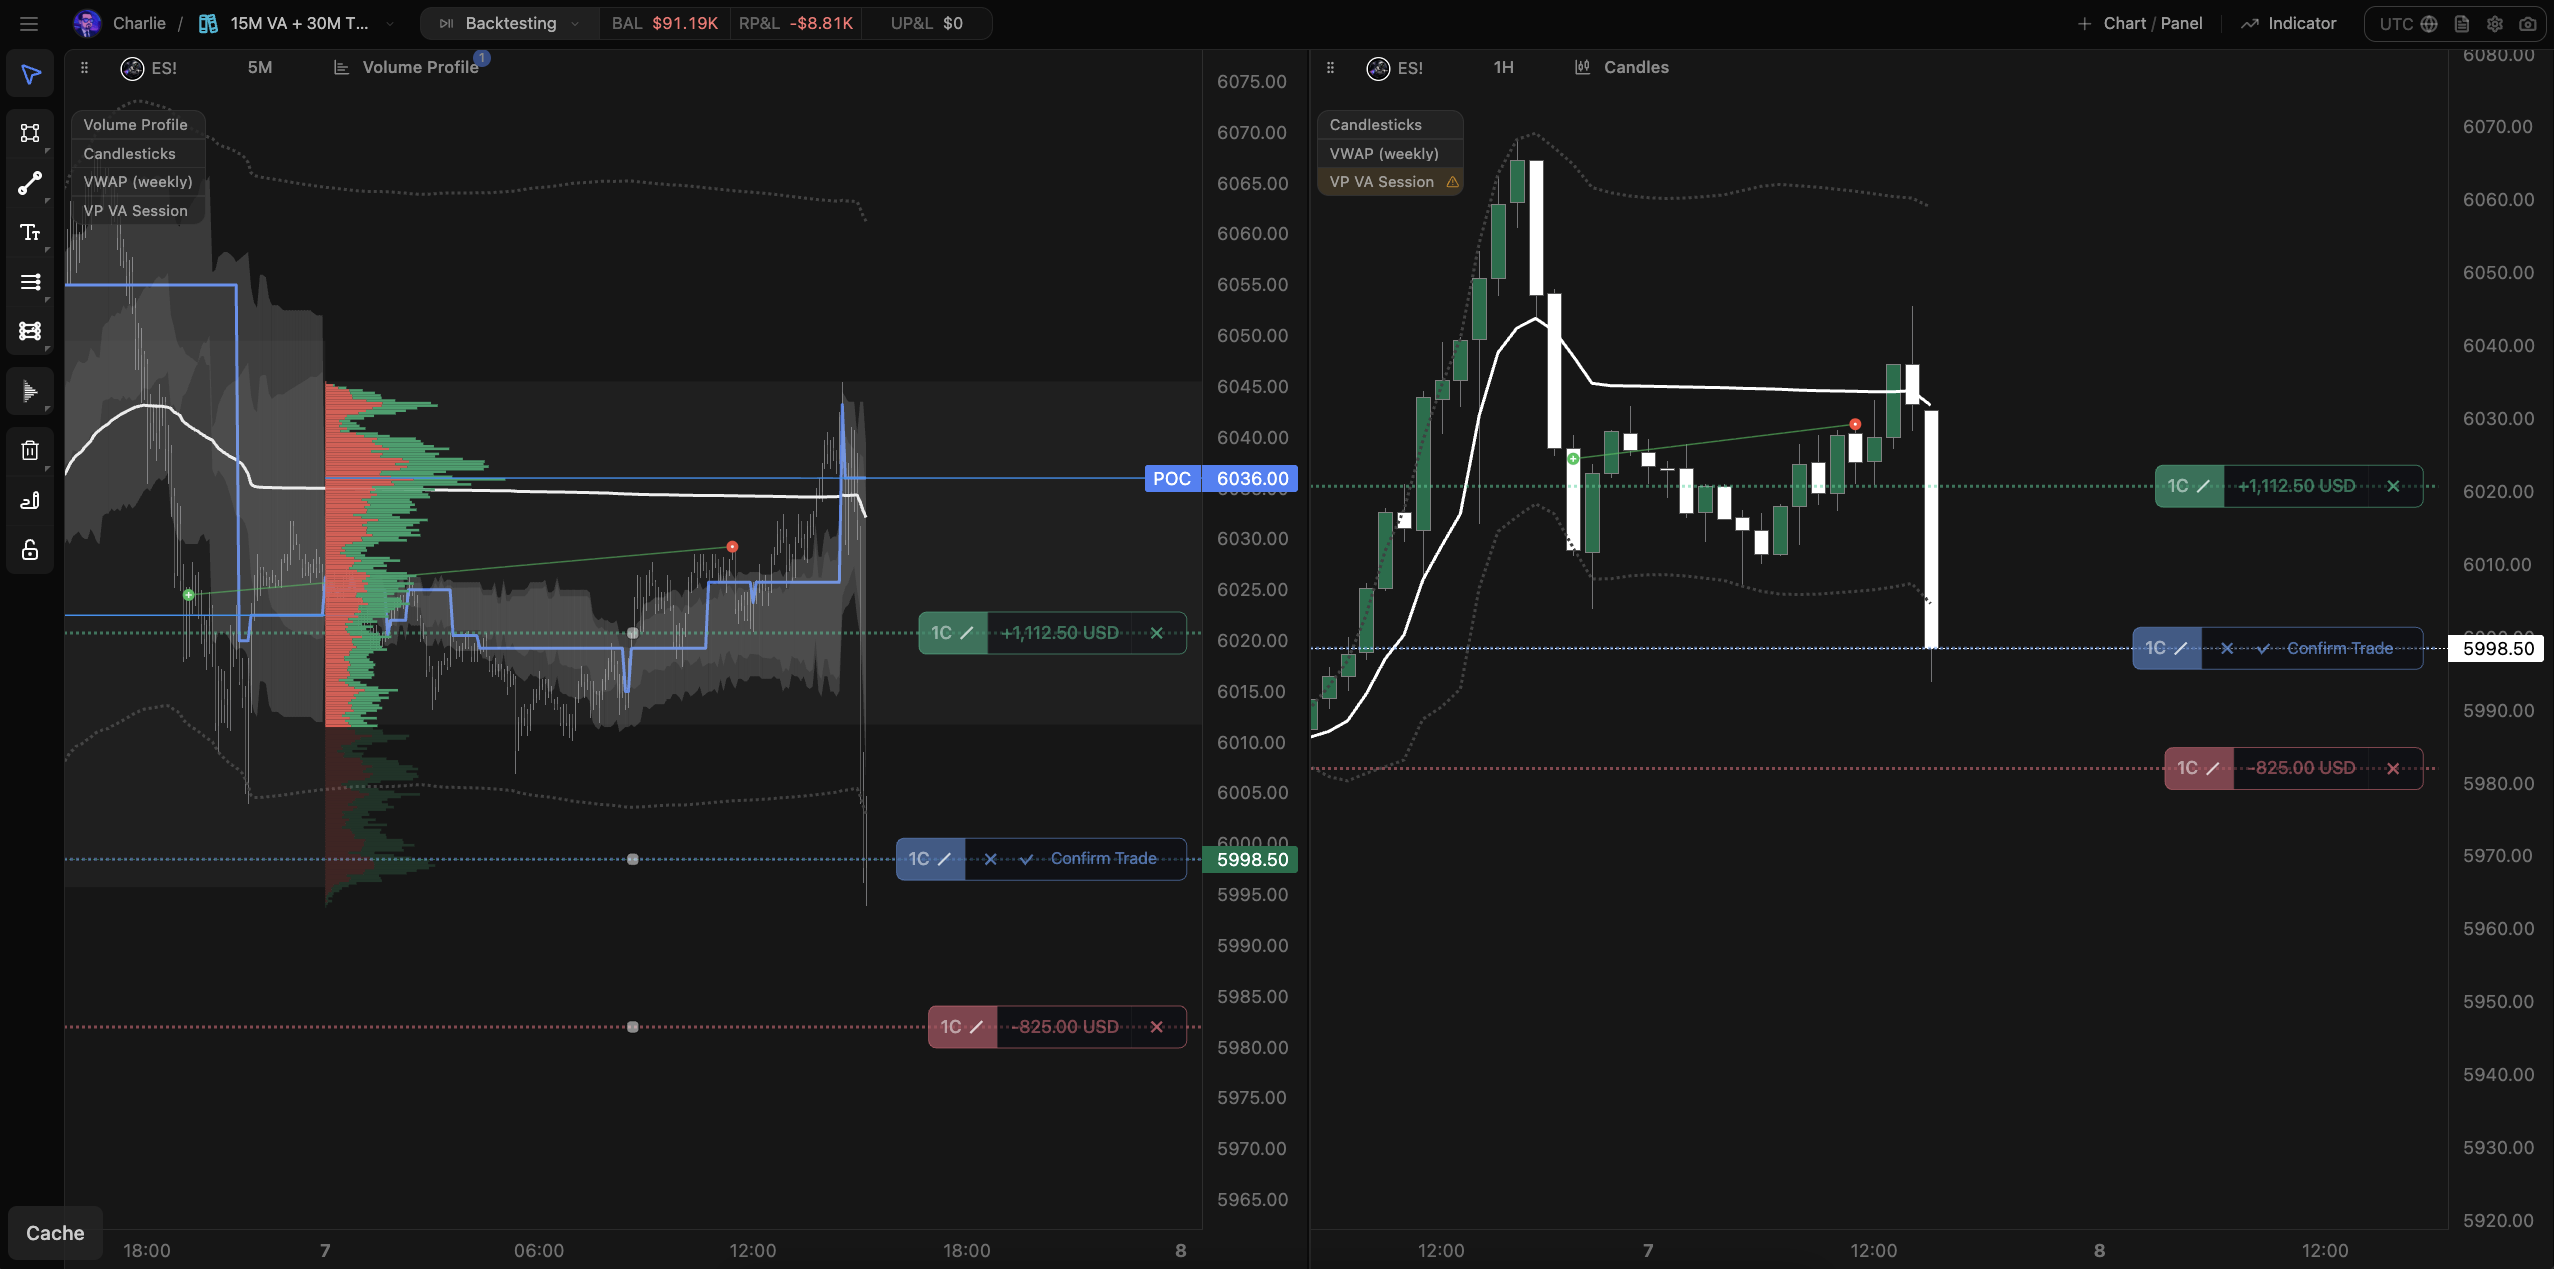
Bar-by-bar replay with realistic commissions, slippage, and risk rules. Sim-mode watchlist respects historical coverage at the replay clock.
Start a replayConnect MT4, MT5, or Chartnaut Demo, manage positions on chart, and bring your study data onto the chart with terminal pins.
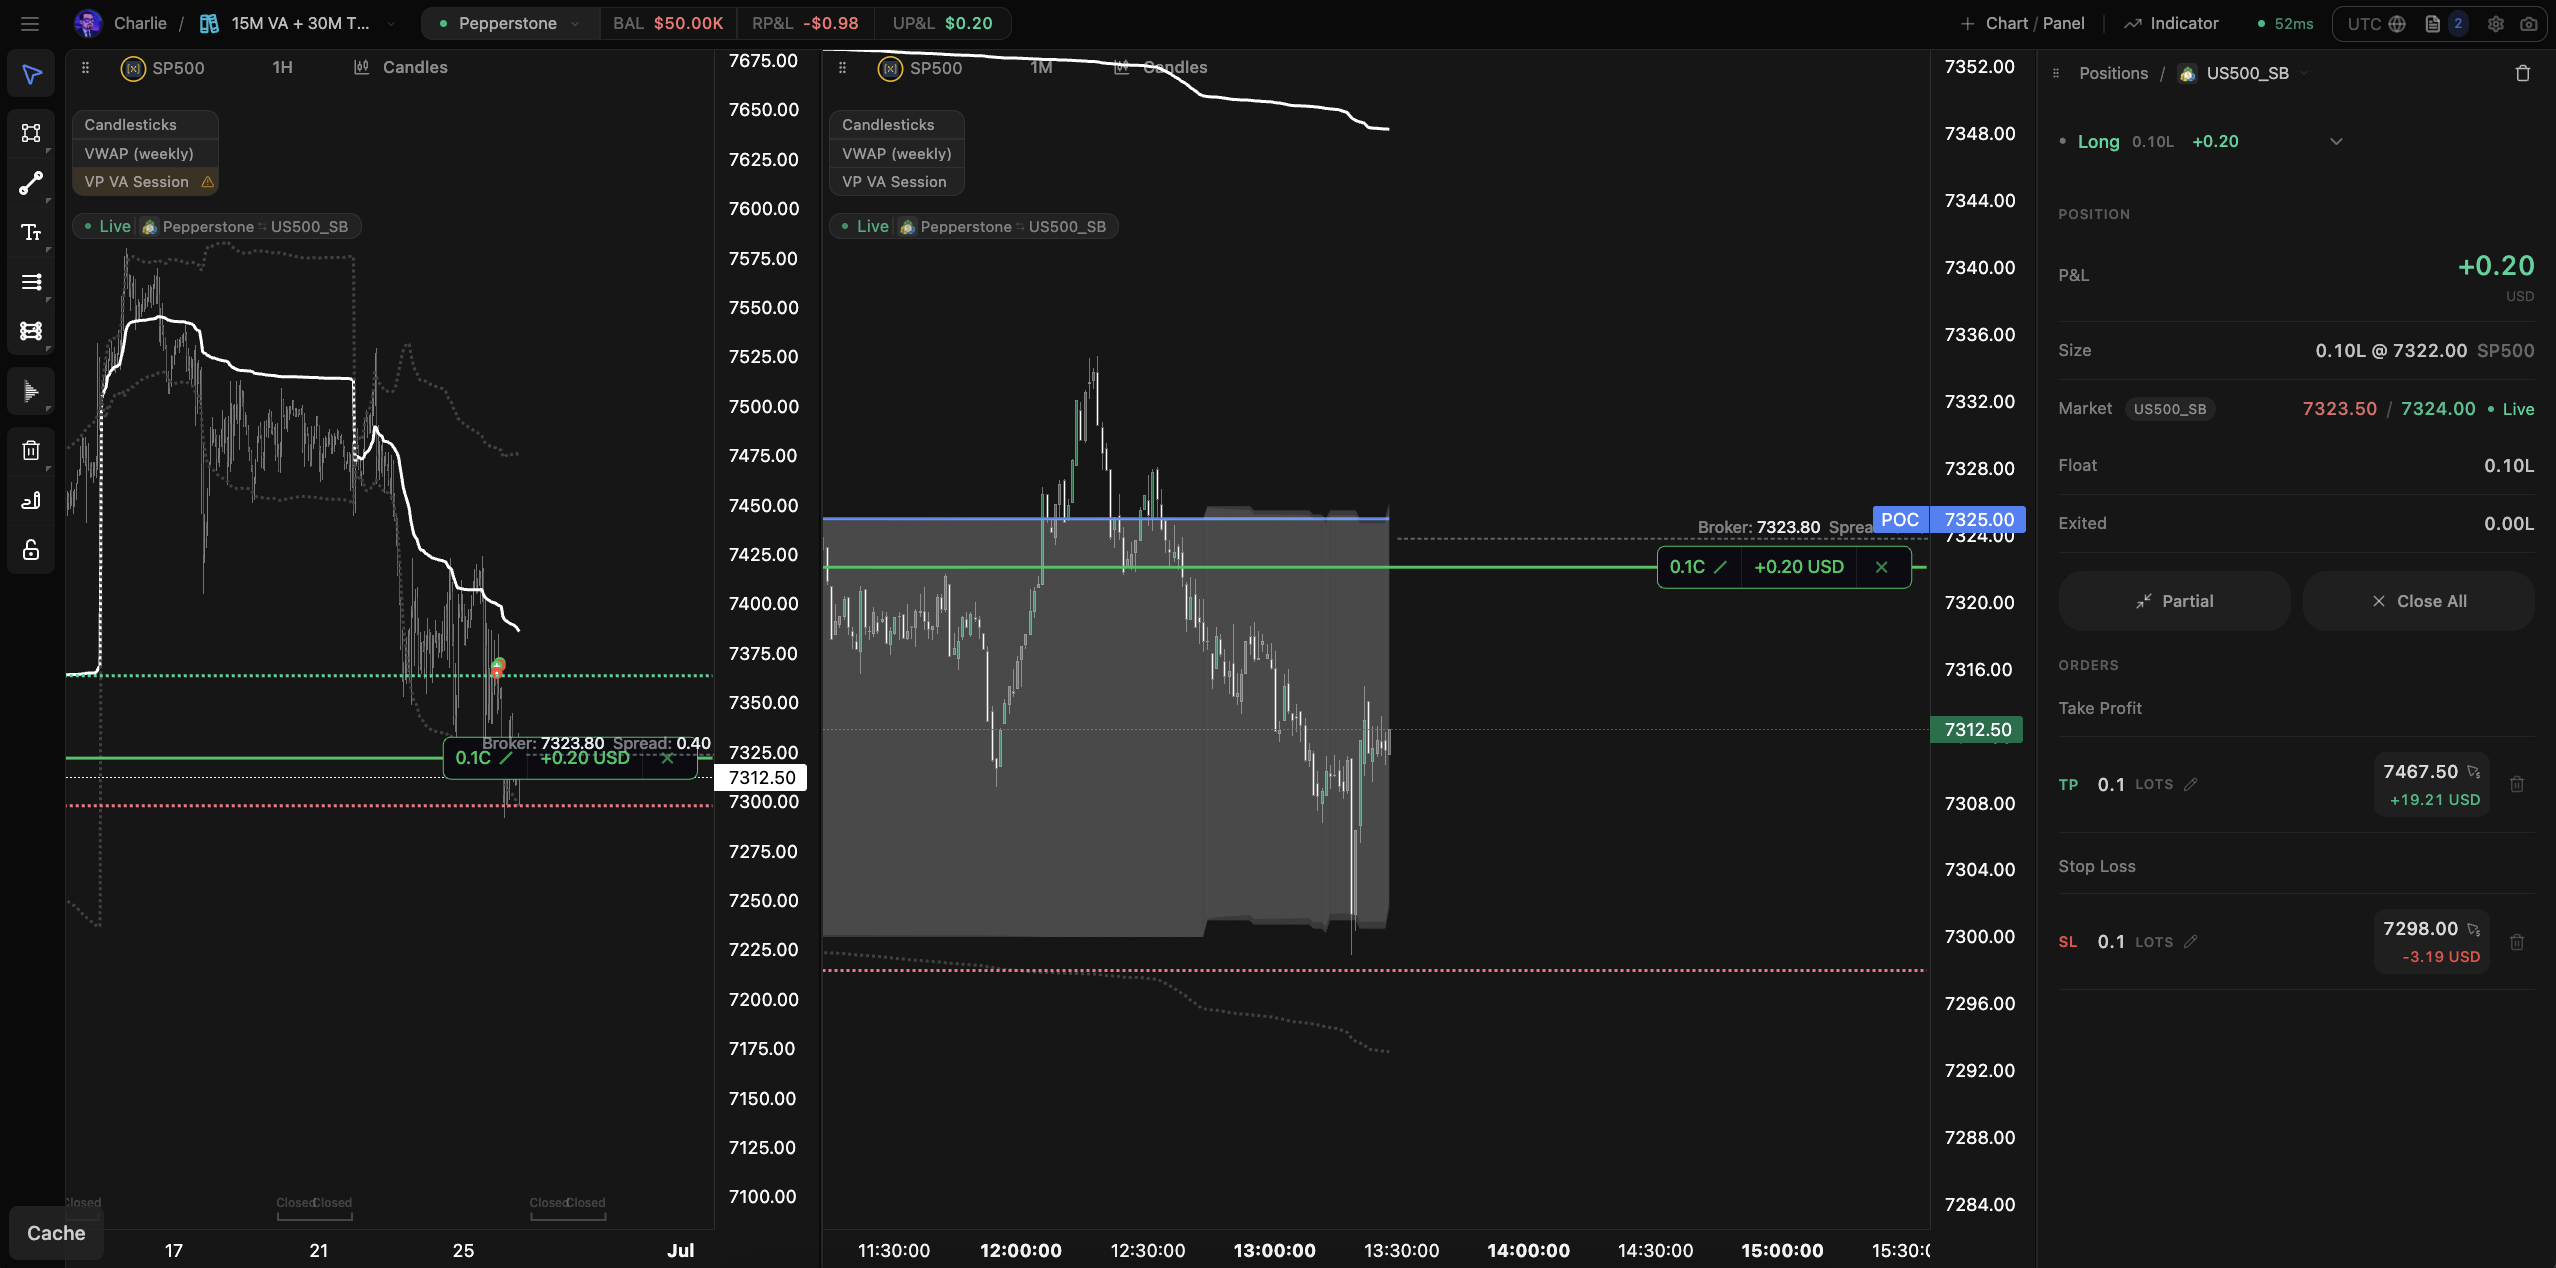
Place and manage orders without leaving the terminal. Drag stop-loss and take-profit on chart, partial close from the position manager, and chart-native entries tied to the bar you are watching.
Broker connectivity
Connect MT4, MT5, or a Chartnaut Demo account — analyse and execute from the same workflow. Symbol mapping handles broker naming automatically.
Every trade you take through Chartnaut — live, demo, sim, or replay — gets a full mosaic snapshot at entry and exit. Branded screenshots with panel layout metadata for journal review.
01
Trade opens
Full mosaic captured at entry.
02
Trade closes
Exit snapshot with same layout restore.
03
Review later
Film strip in your trade journal.
Pin study results to the chart as interactive markers. Click through cohort stats and full results without leaving the session — research surfaced where you actually decide.
See terminal pinsMosaic layouts, nine chart types, built-in indicators, custom signal scripts, broker connectivity, and terminal pins — free for 14 days.
Pick from 15+ preset themes or create your own. Customise chart backgrounds, label styling, colours, and the full dashboard — every surface in the terminal is adjustable.
Start free trialPick a plan, link your brokers, pay for AI as you go. Cancel anytime.
Charts, backtesting, and broker connections for a single setup.
Lock in beta pricing forever
120bc Broker Capacity/month
Example: 1 MT5 account connected for entire month
Broker Capacity
120bc Broker Capacity/month
Any combination of:
Research limits
Most popular
Higher research limits and room for multiple broker accounts.
Lock in beta pricing forever
240bc Broker Capacity/month
Example: 2 MT5 accounts connected for entire month
Broker Capacity
240bc Broker Capacity/month
Any combination of:
Research limits
Maximum research memory for prop-style and multi-account workflows.
Lock in beta pricing forever
480bc Broker Capacity/month
Example: 4 MT5 accounts connected for entire month
Broker Capacity
480bc Broker Capacity/month
Any combination of:
Research limits
How usage works
Your plan covers the terminal and broker connections. AI is billed separately as you go.
Broker Capacity
Every plan includes monthly Broker Capacity. Each connected account spends capacity per day based on its type — MT4/MT5 available now; cTrader and Hyperliquid coming soon. Disconnect an account and capacity returns to your pool. Demo accounts are always free.
AI agents
Plans do not include AI credits. When you run an agent, usage is deducted from your balance — top up anytime, no monthly allowance to track.
Larger top-ups include bonus credits. You only pay for what you use.
Pricing, brokers, credits, the terminal, studies, and how the platform works.
Not financial advice. Chartnaut does not provide trading signals or predictions. Analytics are descriptive and based on your own data.
Yes — connect MT4/MT5 and trade from the terminal. cTrader and Hyperliquid are coming soon. Demo accounts are free and unlimited on every plan.